BENTON COUNTY VS. WASHINGTON COUNTY
Active Inventory by Month
- In Benton County, active listings in January 2024 saw a slight increase compared to January 2023 (2,062 vs. 2,029, a 1.6% increase). Inventory continued to rise through May, with 2024 outpacing 2023 during the spring months, peaking in May 2024 at 2,495 active listings, compared to 2,169 in May 2023 (15% increase). After May, inventory began to decline seasonally but remained higher year-over-year in most months. By December 2024, Benton County listings showed a moderate increase over December 2023 (2,117 vs. 2,030, a 4.3% increase). Benton County's annual inventory in 2024 is still 12.2% lower than its pre-pandemic level in 2018.
- In Washington County, January 2024 also saw an increase in active listings compared to January 2023 (1,126 vs. 1,055, a 6.7% increase). Similar to Benton County, inventory grew steadily through the spring, peaking in May 2024 at 1,298 listings, up from 1,193 in May 2023 (8.8% increase). Washington County experienced a larger inventory rise in the fall, with October 2024 seeing a significant increase (1,378 vs. 1,171, a 17.7% increase). By December 2024, listings in Washington County were up substantially compared to December 2023 (1,221 vs. 1,008, a 21.1% increase).When comparing annual active inventory levels, in 2024 Washington County was 16.7% below its pre-pandemic 2018.
Both counties followed historical seasonality, with spring bringing the highest inventory levels, followed by a decline into late summer and winter.
Price Per Sqft
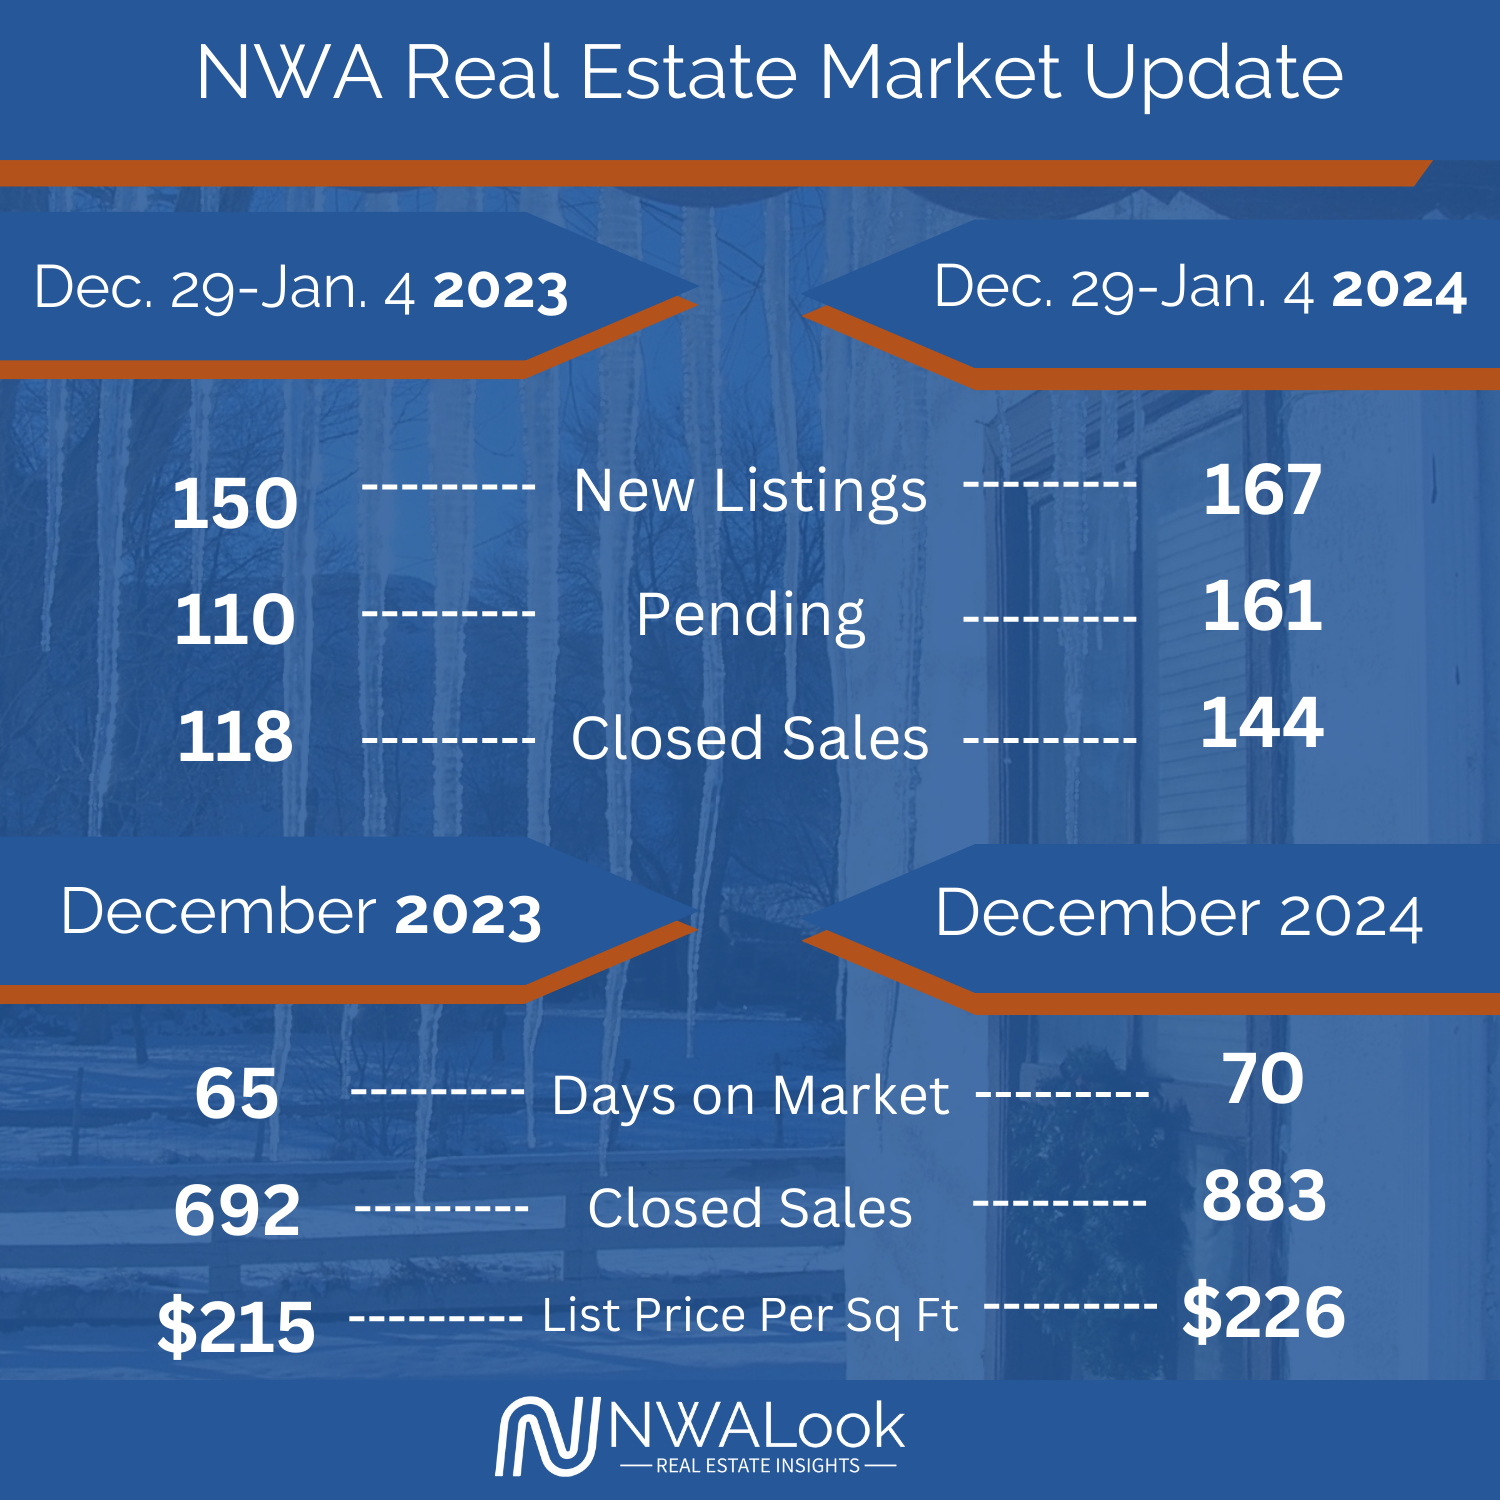
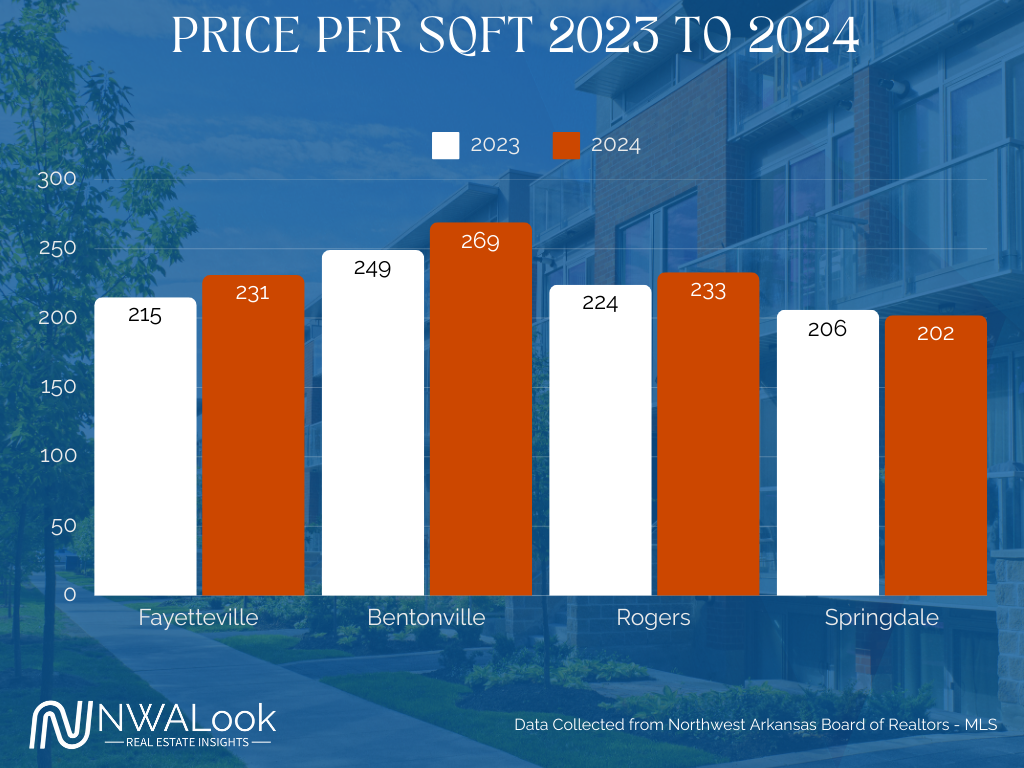
- In Benton County, the average price per square foot increased from $213 in 2023 to $224 in 2024, reflecting a 5.2% increase year-over-year. In Washington County, the average price per square foot rose from $201 in 2023 to $215 in 2024, marking a 7% increase.
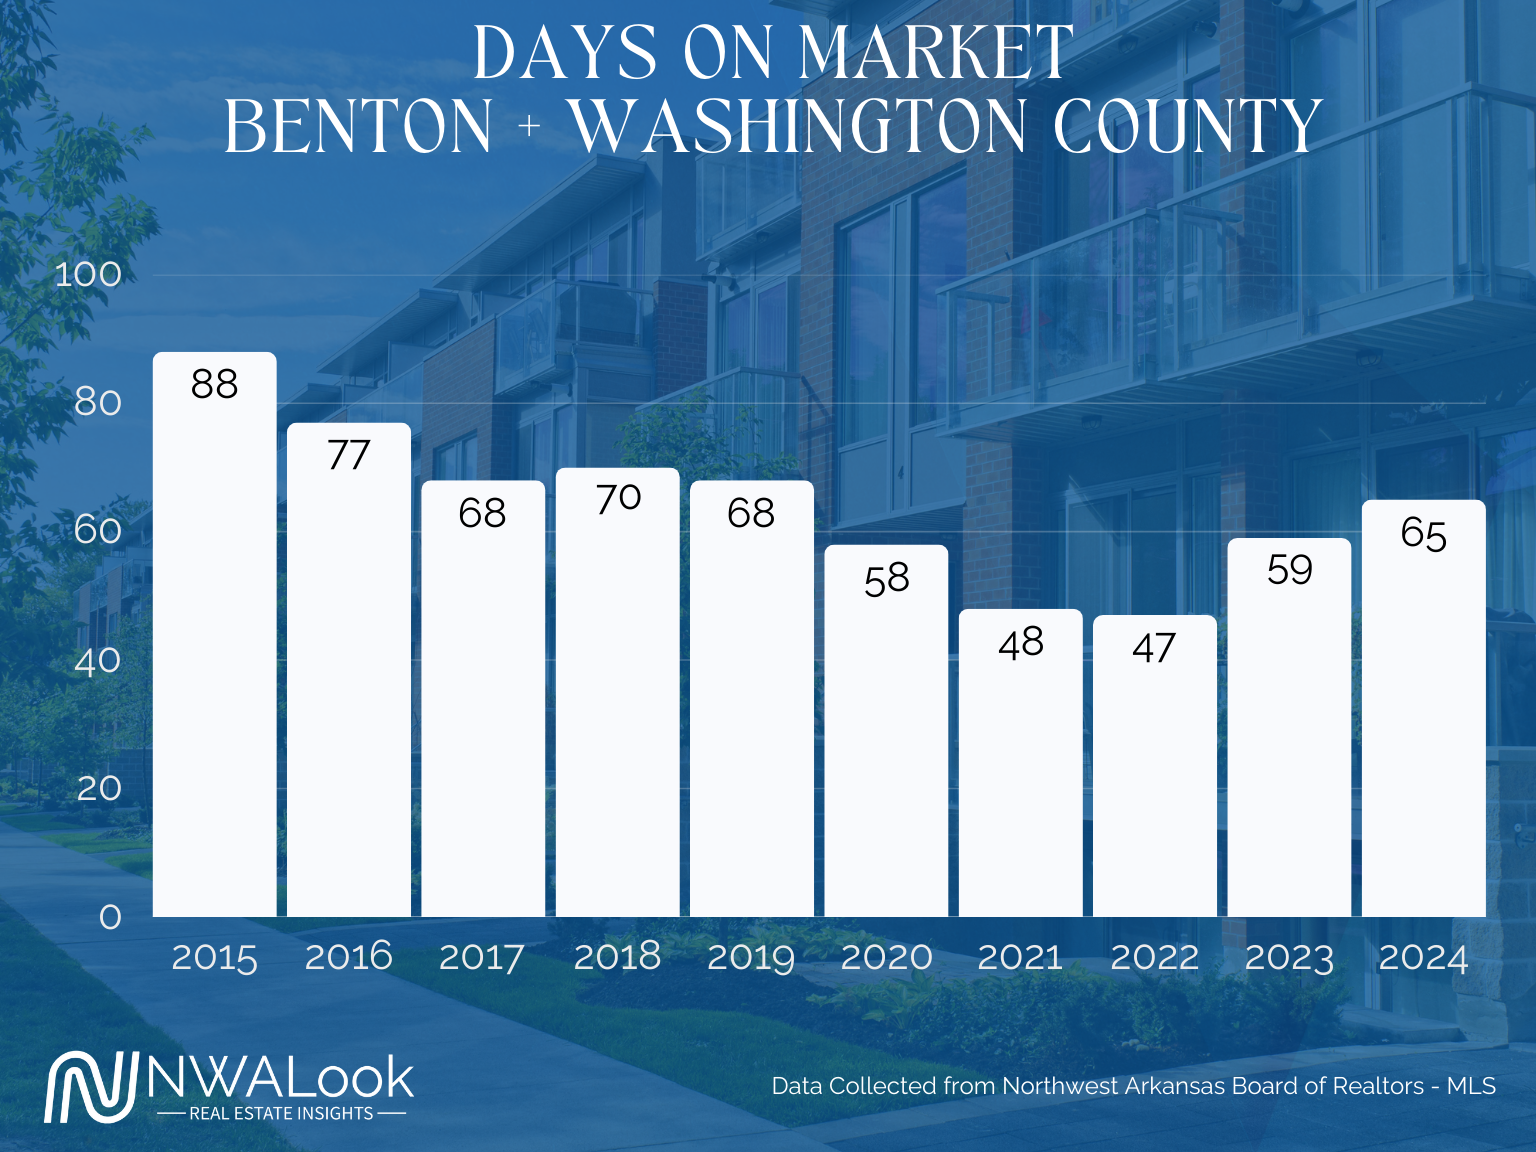
Days on the Market
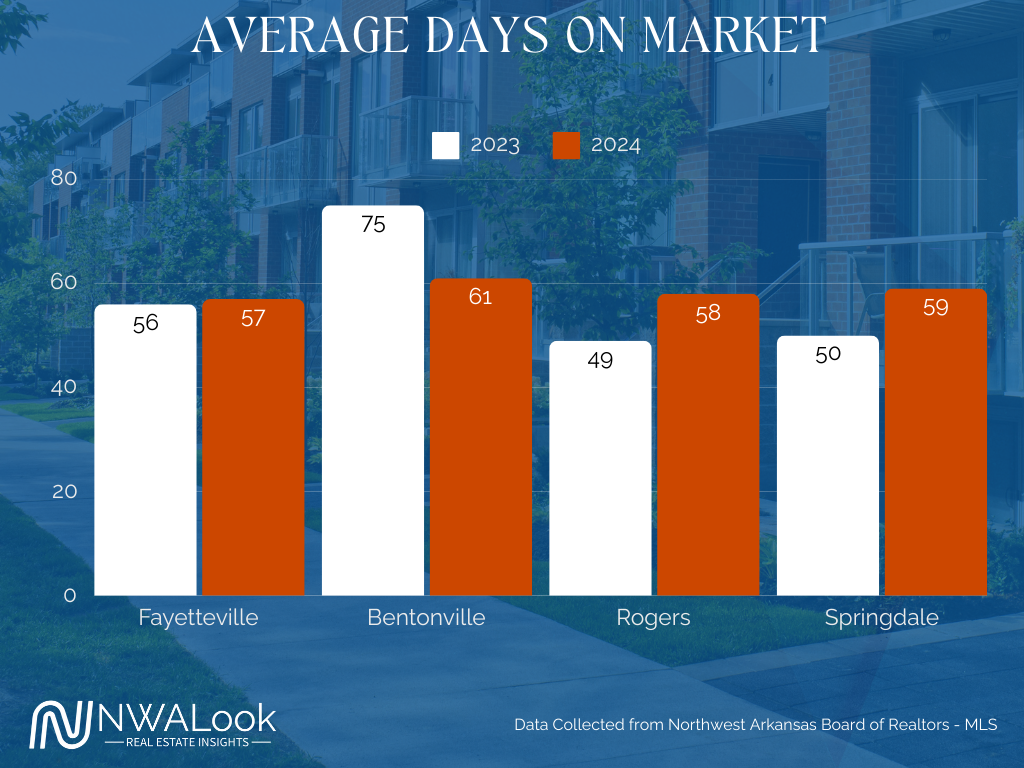
- In Benton County, the average days on the market increased from 61 days in 2023 to 67 days in 2024, a 9.8% rise. In Washington County, the average days on the market also increased, rising from 56 days in 2023 to 61 days in 2024, an 8.9% rise. The modest rise in days on the market for both counties suggests that while demand remains strong, buyers are taking slightly more time to navigate higher prices and borrowing costs
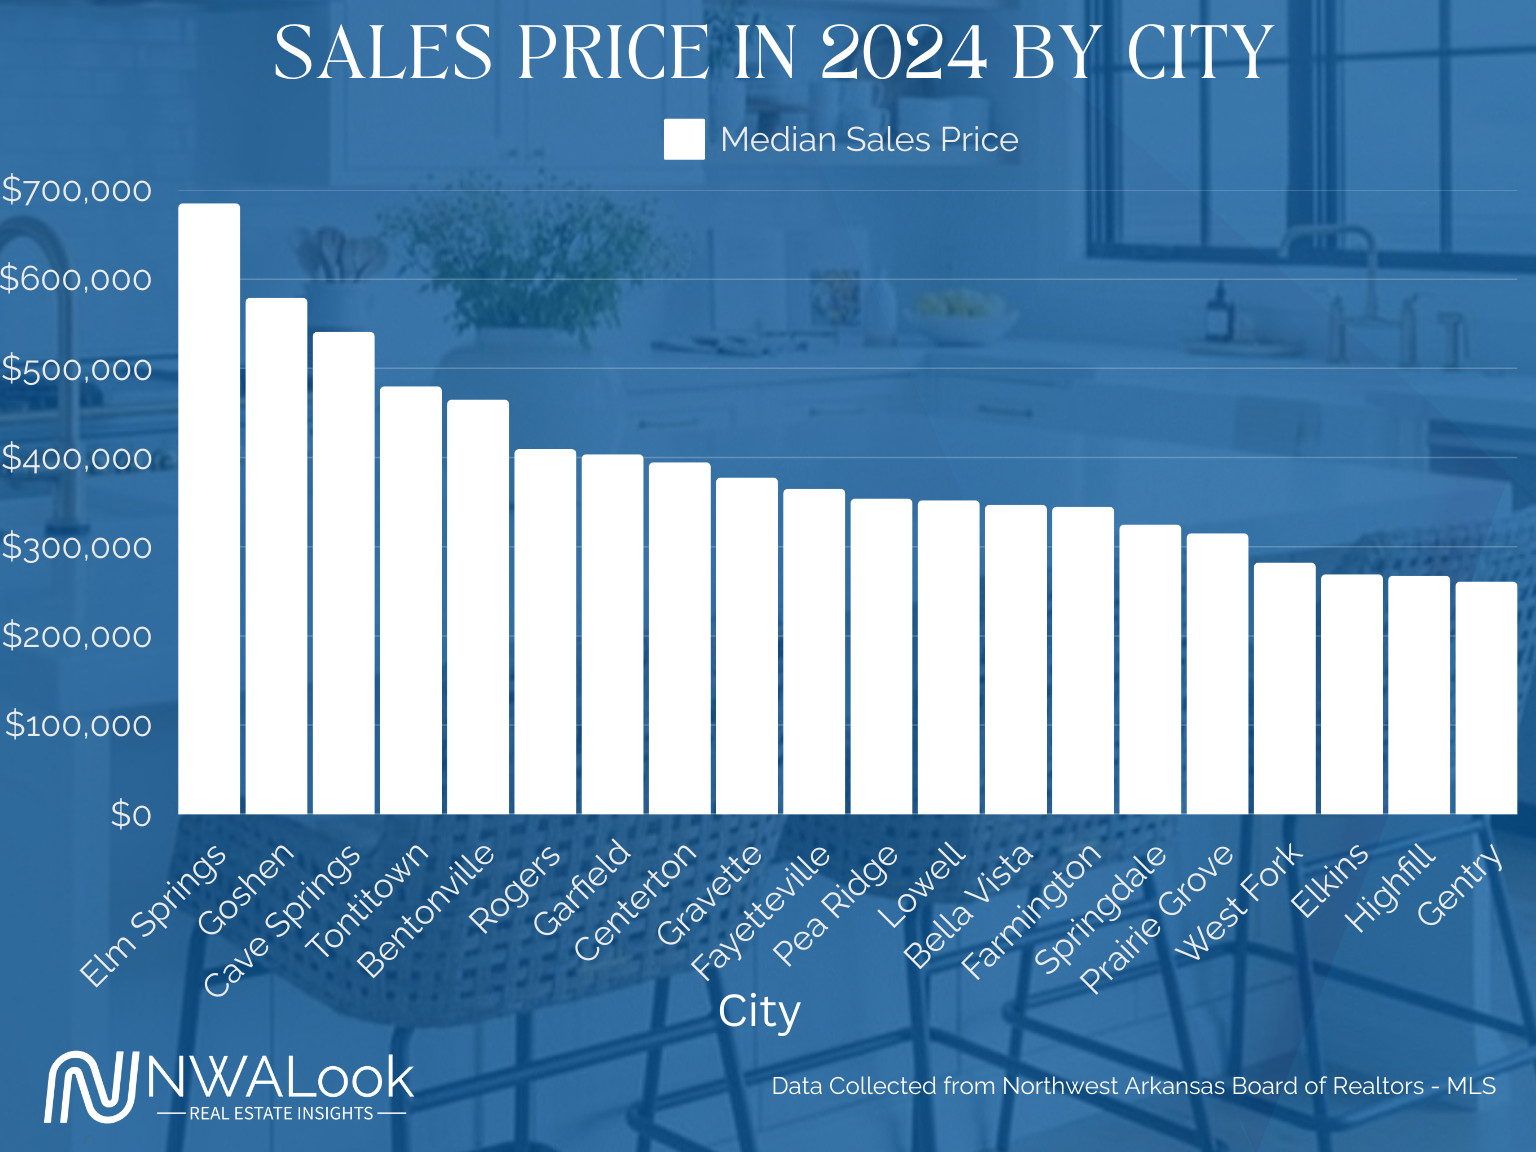
Sales Price
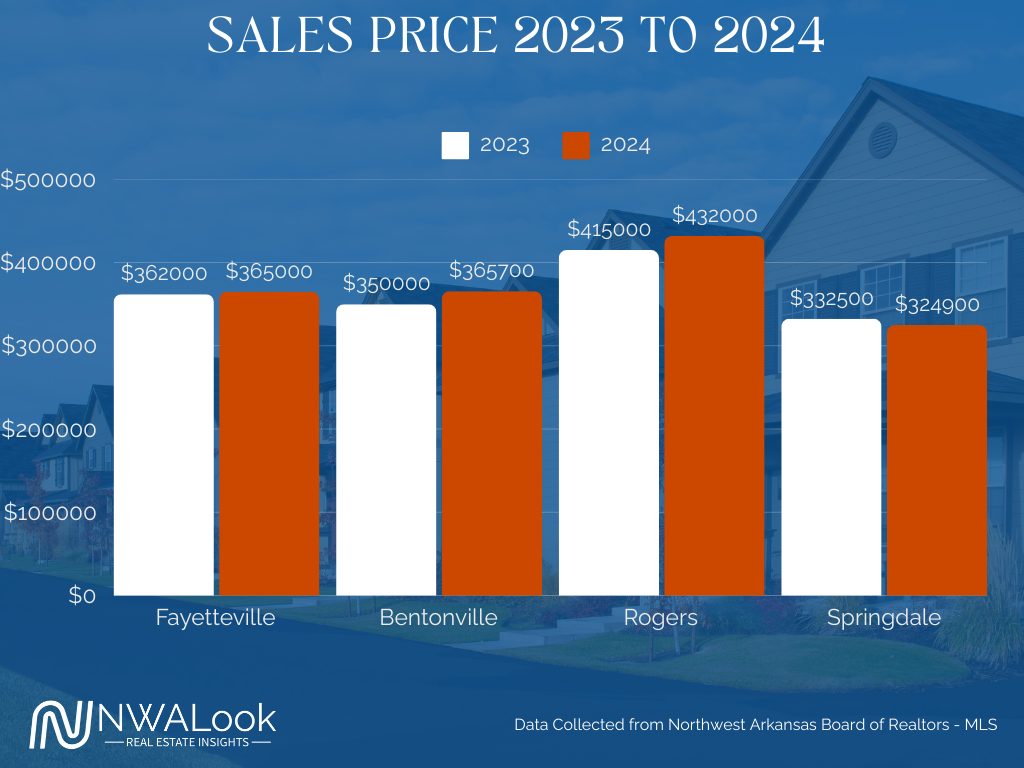
- Benton County, the average sales price increased from $354,475 in 2023 to $374,900 in 2024, representing a 5.8% increase year-over-year. This rise reflects ongoing demand in high-growth cities like Bentonville, Rogers, and Centerton, where job opportunities and amenities continue to drive home values upward.
- In Washington County, the average sales price saw a smaller increase, rising from $332,160 in 2023 to $338,000 in 2024, a 1.8% increase. The slower price growth suggests that Washington County remains a more affordable option for buyers.
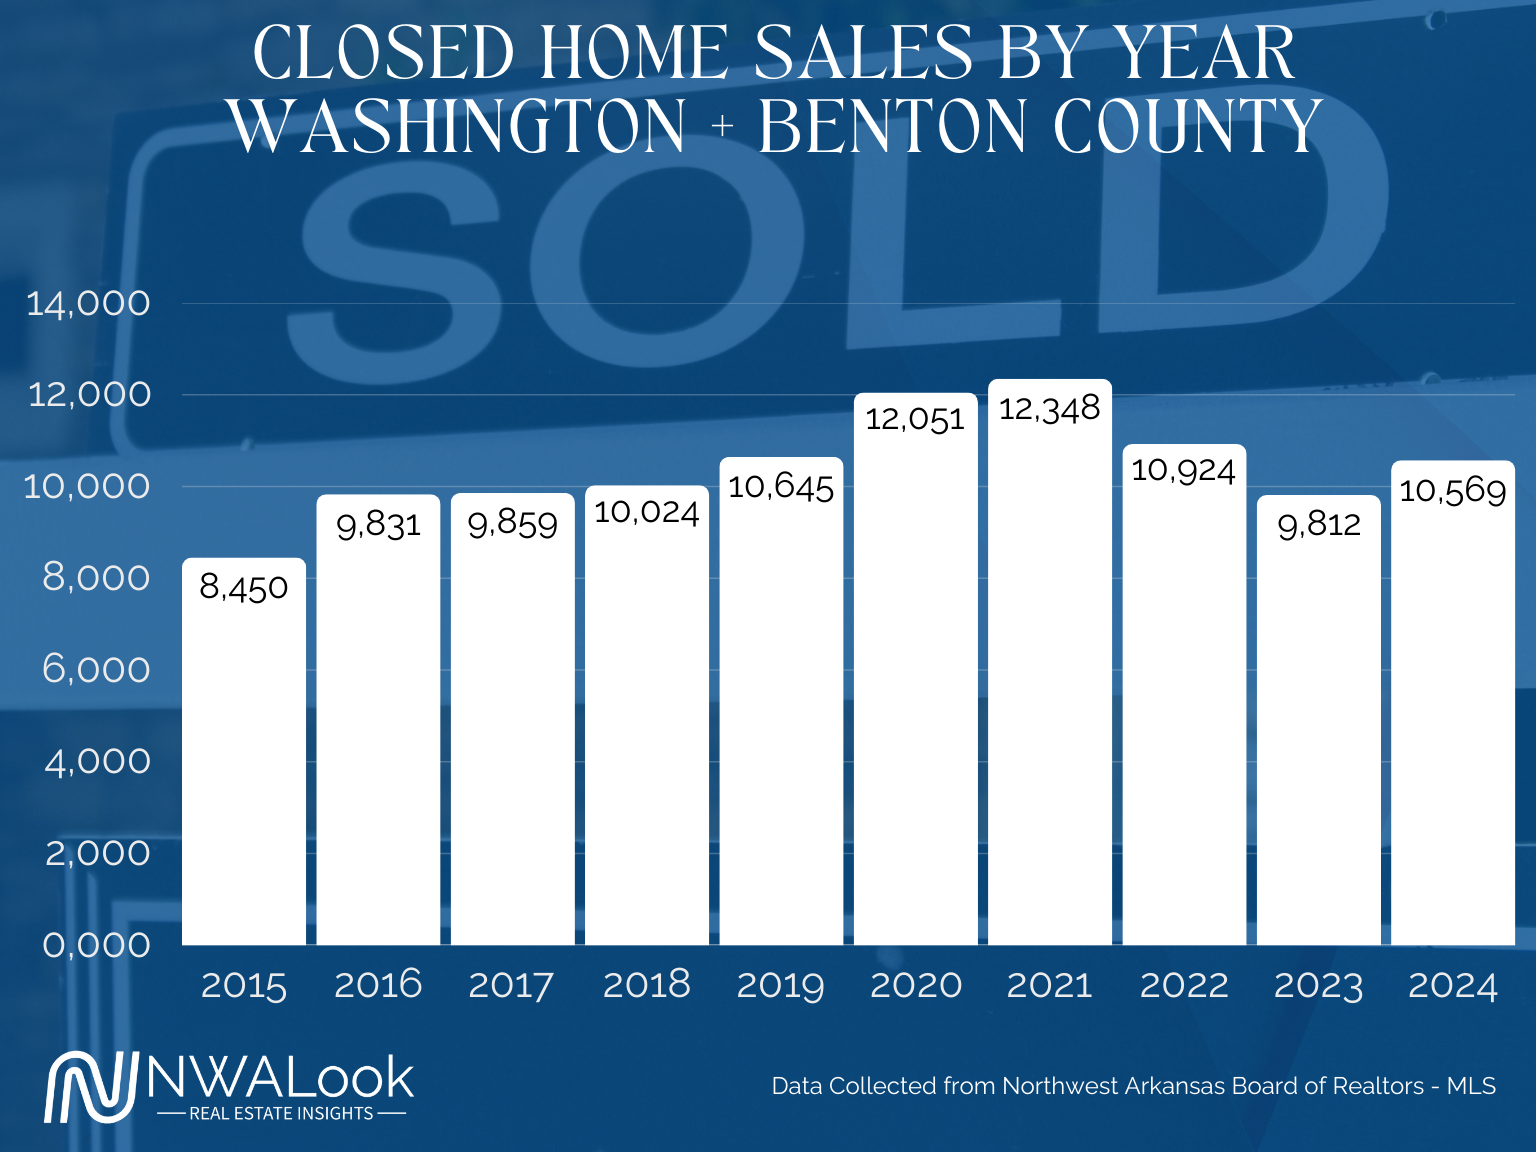
Closed Sales Volume
In Benton County, the number of closed sales increased from 6,334 in 2023 to 6,748 in 2024, a 6.5% rise year-over-year. In Washington County, closed sales grew from 3,478 in 2023 to 3,820 in 2024, a 9.8% increase.
Fayetteville
Active Inventory By Month
- The number of active listings in 2024 declined in January compared to 2023 but steadily increased through April, surpassing the figures from the same months in 2023. However, inventory is still below pre-pandemic levels.
Price Per Square Foot
- The price per square foot increased from $215 in 2023 to $231 in 2024, representing a 7.44% increase year-over-year.
Days on the Market
- The median days on the market remained relatively stable, slightly increasing from 56 days in 2023 to 57 days in 2024.
Sales Price
- The median sales price increased from $362,000 in 2023 to $365,000 in 2024, a modest 0.83% year-over-year increase. The smaller price increase compared to the rise in price per square foot could indicate smaller property sizes or shifts in buyer preferences.
Closed Sales
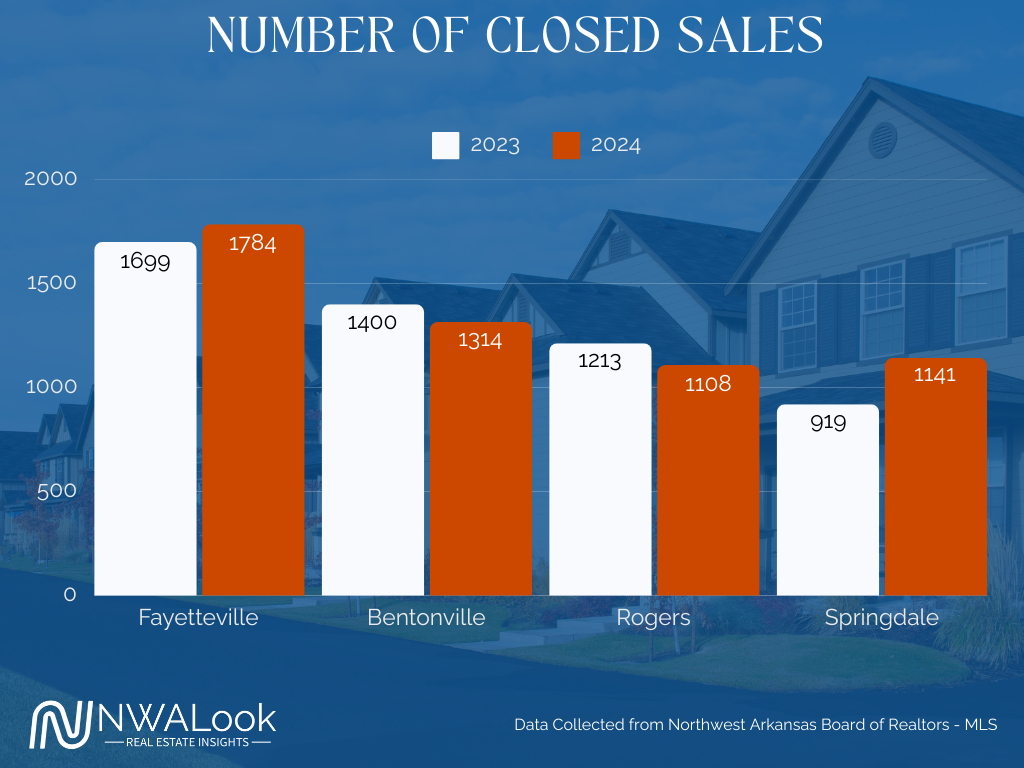
- The number of closed sales increased from 1,699 in 2023 to 1,784 in 2024, a 5% year-over-year increase.
Bentonville
Active Inventory By Month
- There was a significant decline in active listings in January 2024 compared to January 2023. However, active inventory steadily increased from February to April 2024, exceeding 2023 levels by April. This follows the market’s history of seasonality changes, which increase inventory in the Spring and summer months. However, Bentonville is still below the pre-pandemic level by X% # vs #.
Price Per Square Foot
- The price per square foot in Bentonville increased from $249 in 2023 to $269 in 2024, reflecting a year-over-year increase by 8%.
Days on the Market
- The median days on the market significantly decreased by 14 days (18.67% decrease). Homes sold faster in 2024, suggesting increased buyer urgency or stronger demand.
Sales Price
- A 4.49% year-over-year increase in the median sale price reflects continued market strength and rising property values. While the growth is moderate compared to price per square foot, it reflects the overall upward trend in the market.
Closed Sales Volume
- The number of closed sales declined 6.10% year over year despite an increase in active inventory. While the market remained active, rising prices affected affordability, potentially reducing the number of successful transactions.
Rogers
Active Inventory By Month
- There was an increase in active listings in January 2024 compared to January 2023 (335 vs. 258), continuing to rise through April. This increase aligns with typical seasonality as inventory grows during the spring months. However, starting in May, 2024 saw fewer active listings compared to 2023, with a noticeable dip in June and August. By October, the number of active listings in 2024 matched those of 2023, stabilizing toward the end of the year.
Price Per Square Foot
- The price per square foot increased from $224.00 in 2023 to $233.00 in 2024, representing a 4.02% year-over-year increase. This steady rise highlights growing demand in the Rogers market and reflects the area's increasing property value.
Days on the Market
- The median days to sell increased from 49 days in 2023 to 58 days in 2024, reflecting an 18.37% year-over-year increase. This increase in days on market is likely due to decreasing affordability. While demand remains steady, higher prices and increased inventory may be giving buyers slightly more time to make decisions.
Sales Price
- The median sales price increased from $415,000 in 2023 to $432,000 in 2024, representing a 4.10% year-over-year increase. This steady rise indicates the real estate market's continued strength, even as affordability challenges grow. It reflects strong demand for properties in Rogers despite economic pressures.
Closed Sales Volume
The number of closed sales decreased from 1,213 in 2023 to 1,108 in 2024, reflecting an 8.66% year-over-year decline. This decline likely reflects the impact of decreasing affordability, where rising prices and other economic factors like interest rates have reduced the number of successful transactions.
Springdale
Active Inventory By Month
- Active listings in Springdale increased in 2024 compared to 2023. The year began with a jump from 233 listings in January 2023 to 300 in January 2024. The trend continued with 2024 inventory exceeding 2023 levels for most months, particularly in the last quarter. October, November, and December saw significant increases, with December ending at 374 listings compared to 275 in December 2023. This suggests a growing housing supply in 2024, giving buyers more options while moderating market competition.
Price Per Square Foot
- The price per square foot decreased from $206.00 in 2023 to $202.00 in 2024, reflecting a 1.94% year-over-year decline. This decrease may indicative of an increase in inventory giving buyers more negotiating power. It may also reflect a shift in the type or size of homes being sold.
Days on the Market
- The median days to sell increased from 50 days in 2023 to 59 days in 2024, reflecting an 18% year-over-year increase. This indicates that homes are taking slightly longer to sell in 2024, likely due to increased inventory levels and affordability challenges, which may give buyers more time to make purchasing decisions.
Sales Price
- The median sales price decreased from $332,500.00 in 2023 to $324,900.00 in 2024, reflecting a 2.3% year-over-year decline. This decline could indicate that sellers are adjusting prices to attract buyers in a market with increasing inventory and longer selling times. It may also reflect a shift in the type or value of homes being sold in Springdale.
Closed Sales Volume
- The number of closed sales increased from 919 in 2023 to 1,141 in 2024, reflecting a 24.1% year-over-year increase. This significant rise suggests that despite a slight decrease in median sales price and price per square foot, buyer activity has strengthened in 2024. The increase in closed sales could be driven by higher inventory levels providing more opportunities for buyers or potentially more competitive pricing.
Northwest Arkansas is set for strong growth in 2025, with 36 new residents moving to the region daily, according to the NWA Council. This influx will fuel demand for housing, particularly in more affordable areas like Springdale, Centerton, Bella Vista, and Pea Ridge, as buyers seek alternatives to higher-priced markets such as Bentonville and Rogers. While interest rates are likely to hover around 7% through 2024, there is a potential to dip to 6.5% on average by late 2025. Which could enhance affordability and spring additional buyer into the real estate market.
Infrastructure upgrades, including the Highway 612 bypass, will boost accessibility and make areas like Tontitown more attractive by shortening commutes to major employers like JB Hunt and Walmart. Fayetteville will see steady demand tied to the University of Arkansas.These trends point to steady growth in Northwest Arkansas, with home prices expected to increase by an average of 3-5% annually. Some areas may see higher increases due to supply and demand driven by location.