



By Desiree Stock, Executive Broker, Collier & Associates
November 5, 2026 edition · October 1–31, 2025 vs. October 1–31, 2026 · Benton and Washington counties
October Closings Fell, With a Sharper Slowdown in Benton County
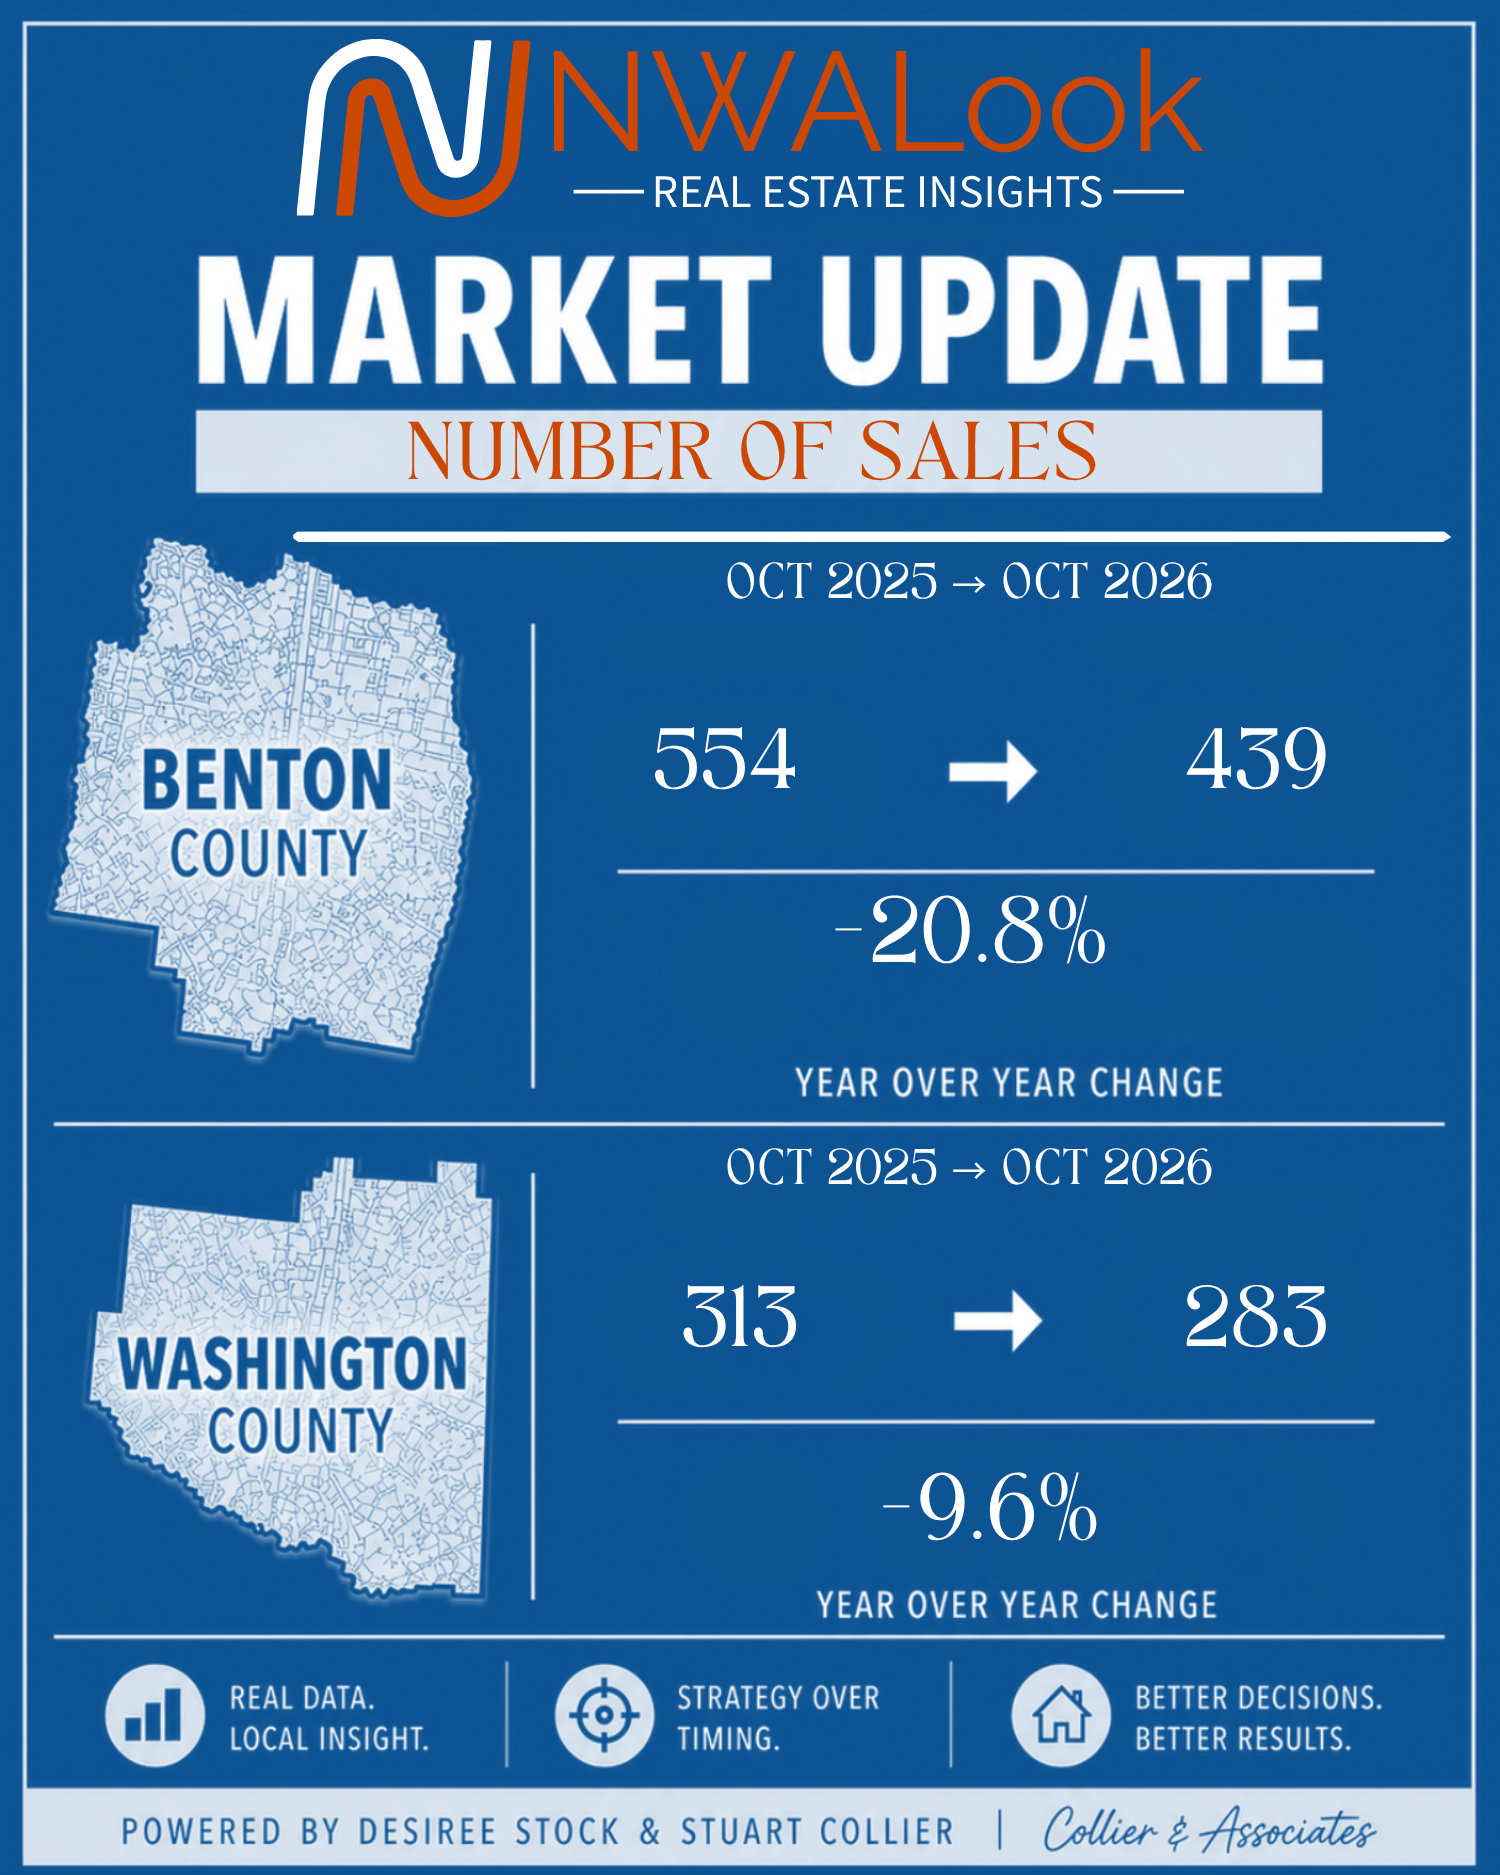
Northwest Arkansas recorded 722 residential closings in Benton and Washington counties during October 2026, compared with 867 in October 2025. That is 145 fewer sales, a decline of 16.7%.
Both counties recorded fewer closings and lower median sold prices, but the details differed. Benton County had a larger decline in sales and a longer median time on market among homes that closed. Washington County’s median sold price fell even as its median sold price per square foot increased.
The price brackets add another layer. Benton County’s $300,000–$499,999 segment held nearly steady while several other brackets contracted sharply. In Washington County, sales below $300,000 increased while every higher bracket in this analysis recorded fewer closings.
October by the Numbers
Residential properties · October 1–31 in each year · 2025 followed by 2026
Fewer Sales and Lower Median Prices in Both Counties
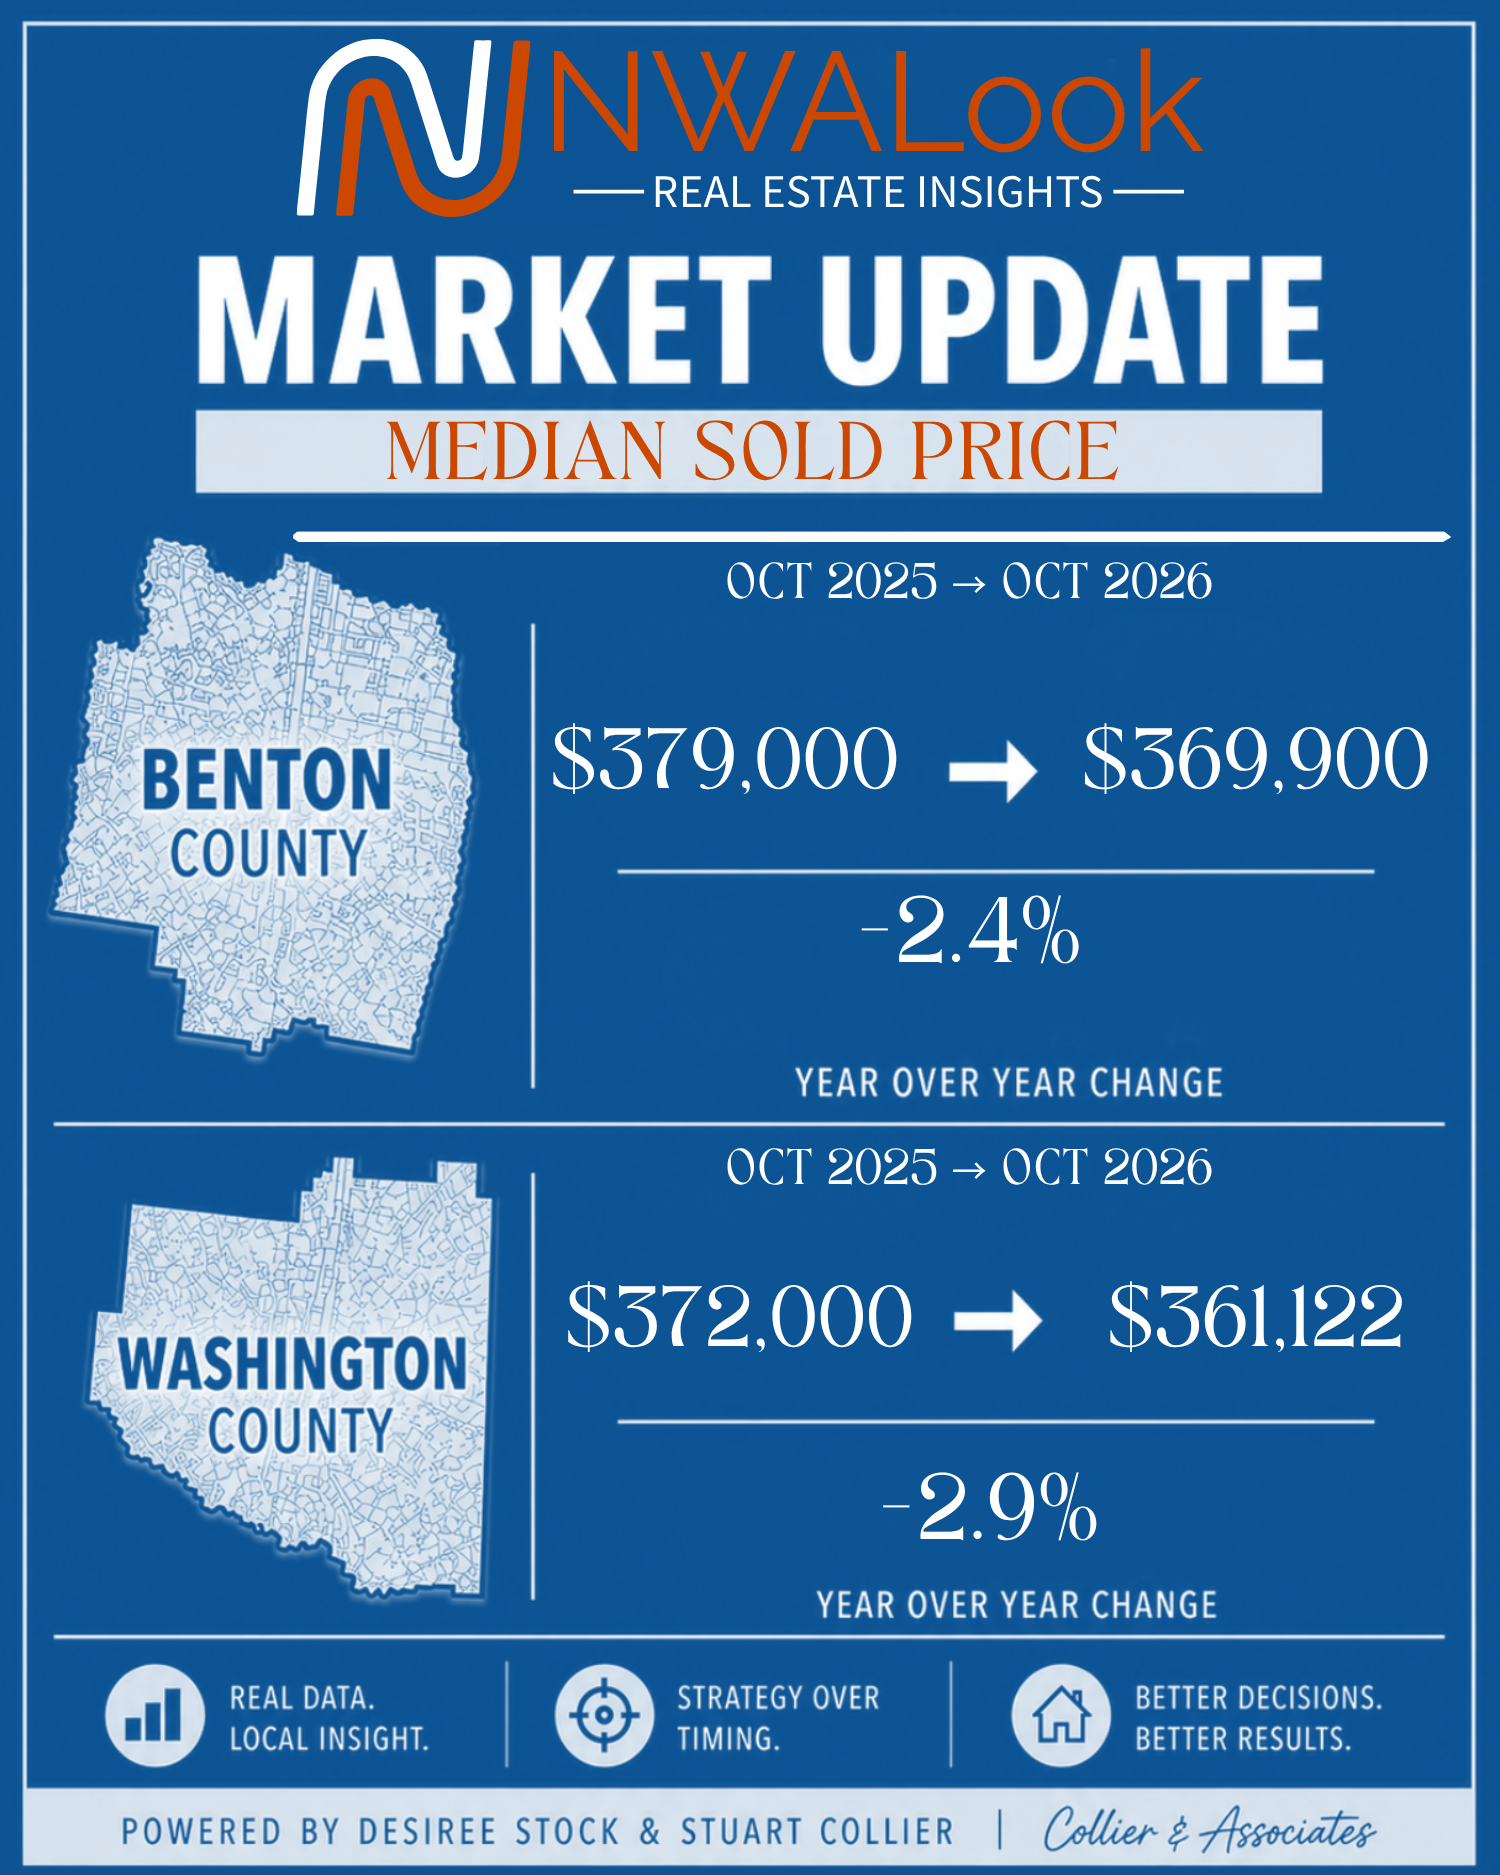
Benton County closed 439 homes, down 20.8% from 554 a year earlier. Its median sold price declined 2.4%, from $379,000 to $369,900.
Washington County closed 283 homes, down 9.6% from 313. Its median sold price declined 2.9%, from $372,000 to $361,122.
Across both counties, the median sold price moved from $375,000 to $367,750, down 1.9%. This combined median is calculated from individual sales across both counties, rather than by averaging the county medians.
A median describes the midpoint of the properties that sold. It does not mean every home lost that percentage of its value. Differences in location, size, condition, and the mix of homes closing can change the result.
The Price Range Changes the Story
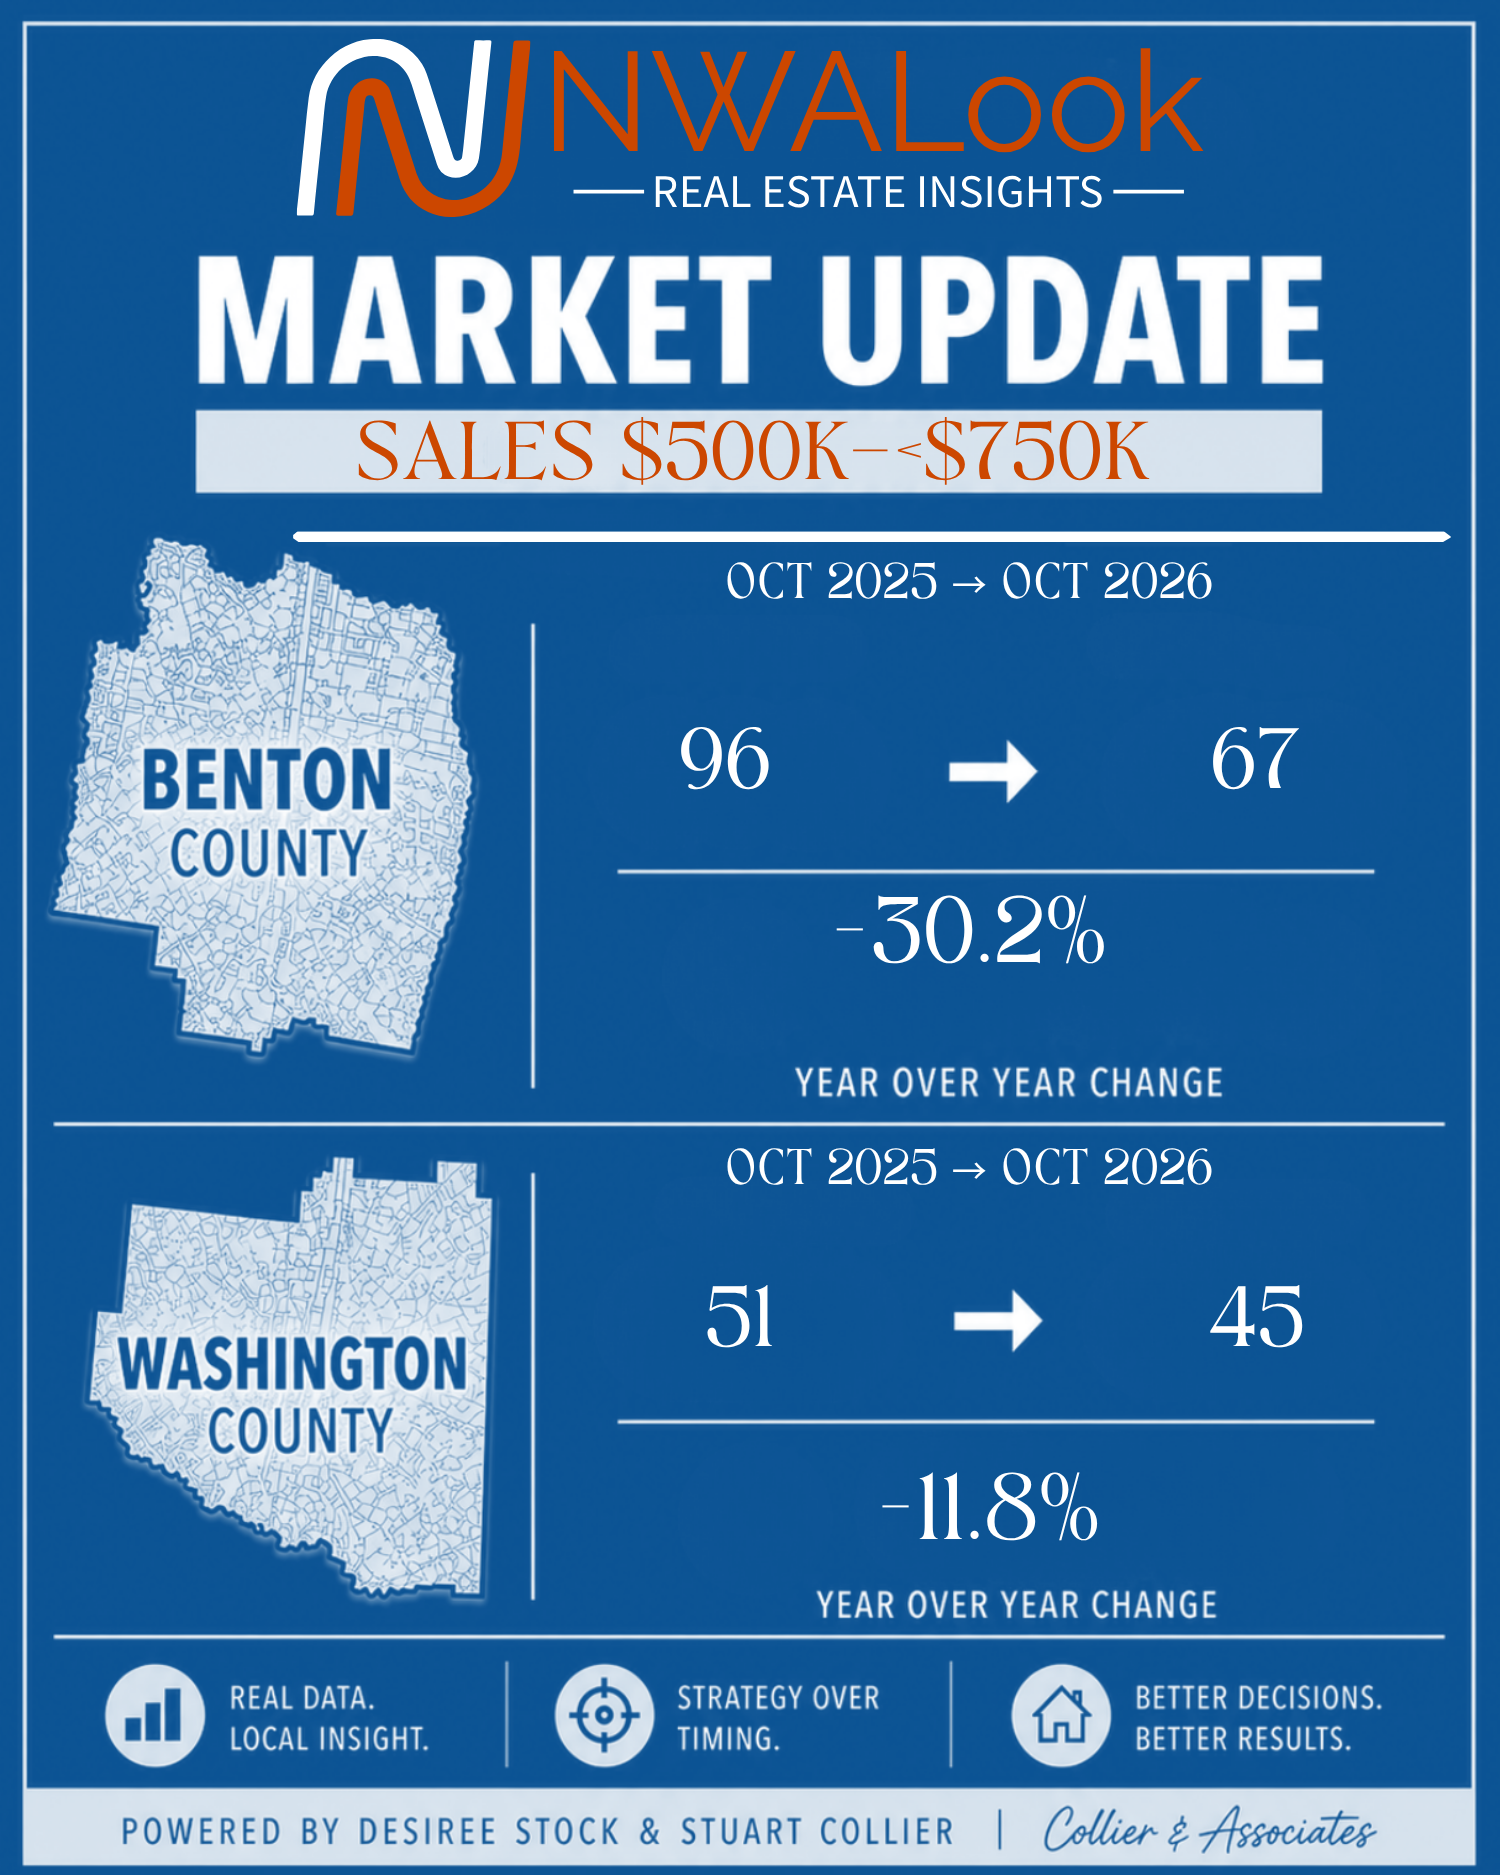
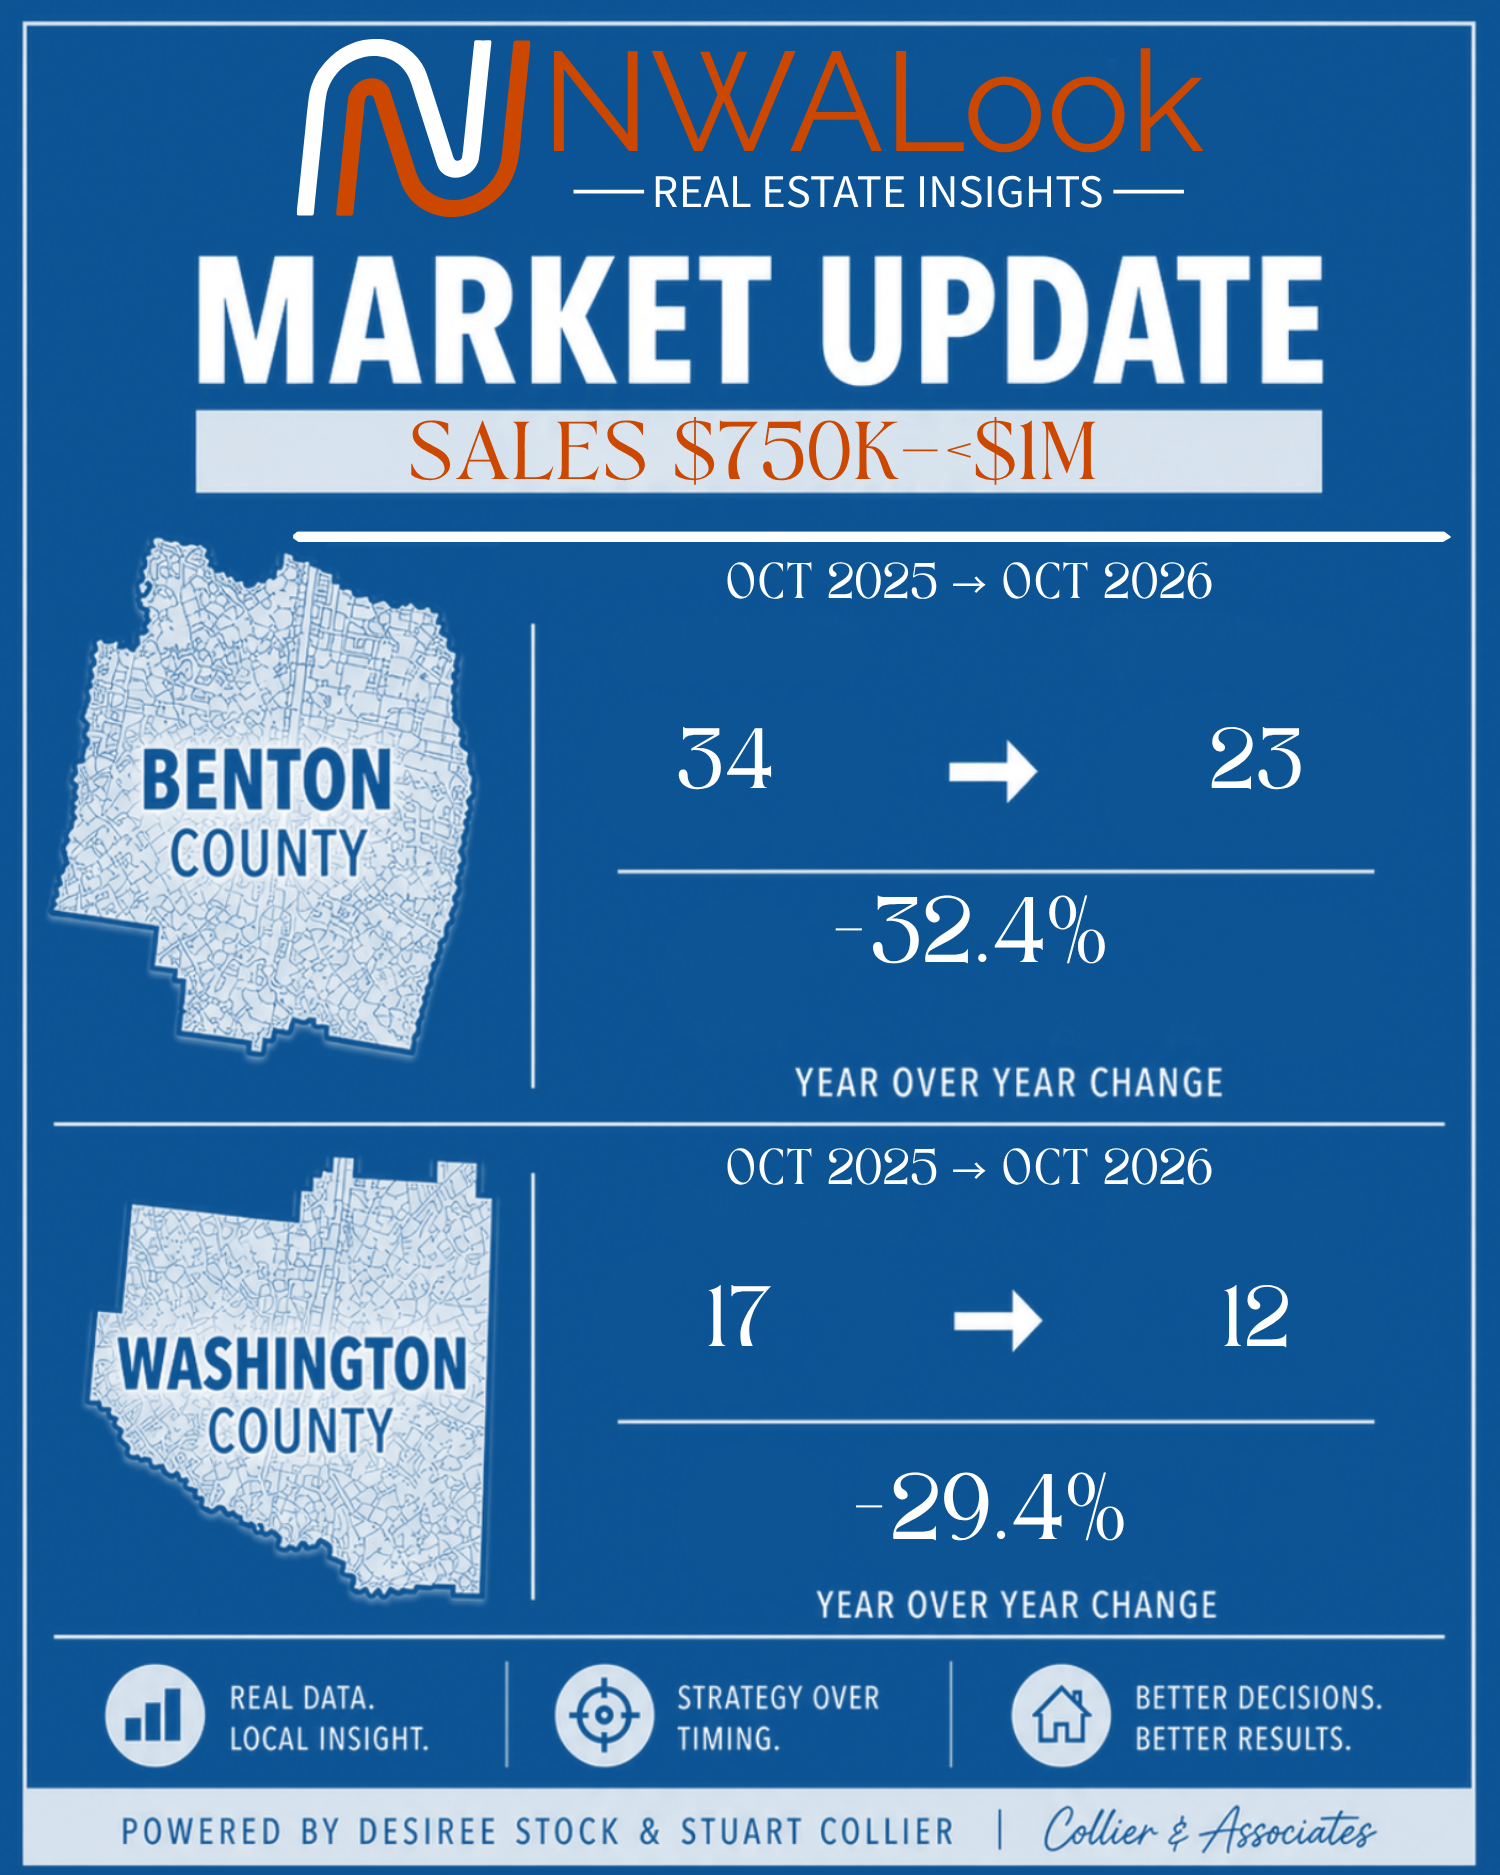
Benton County
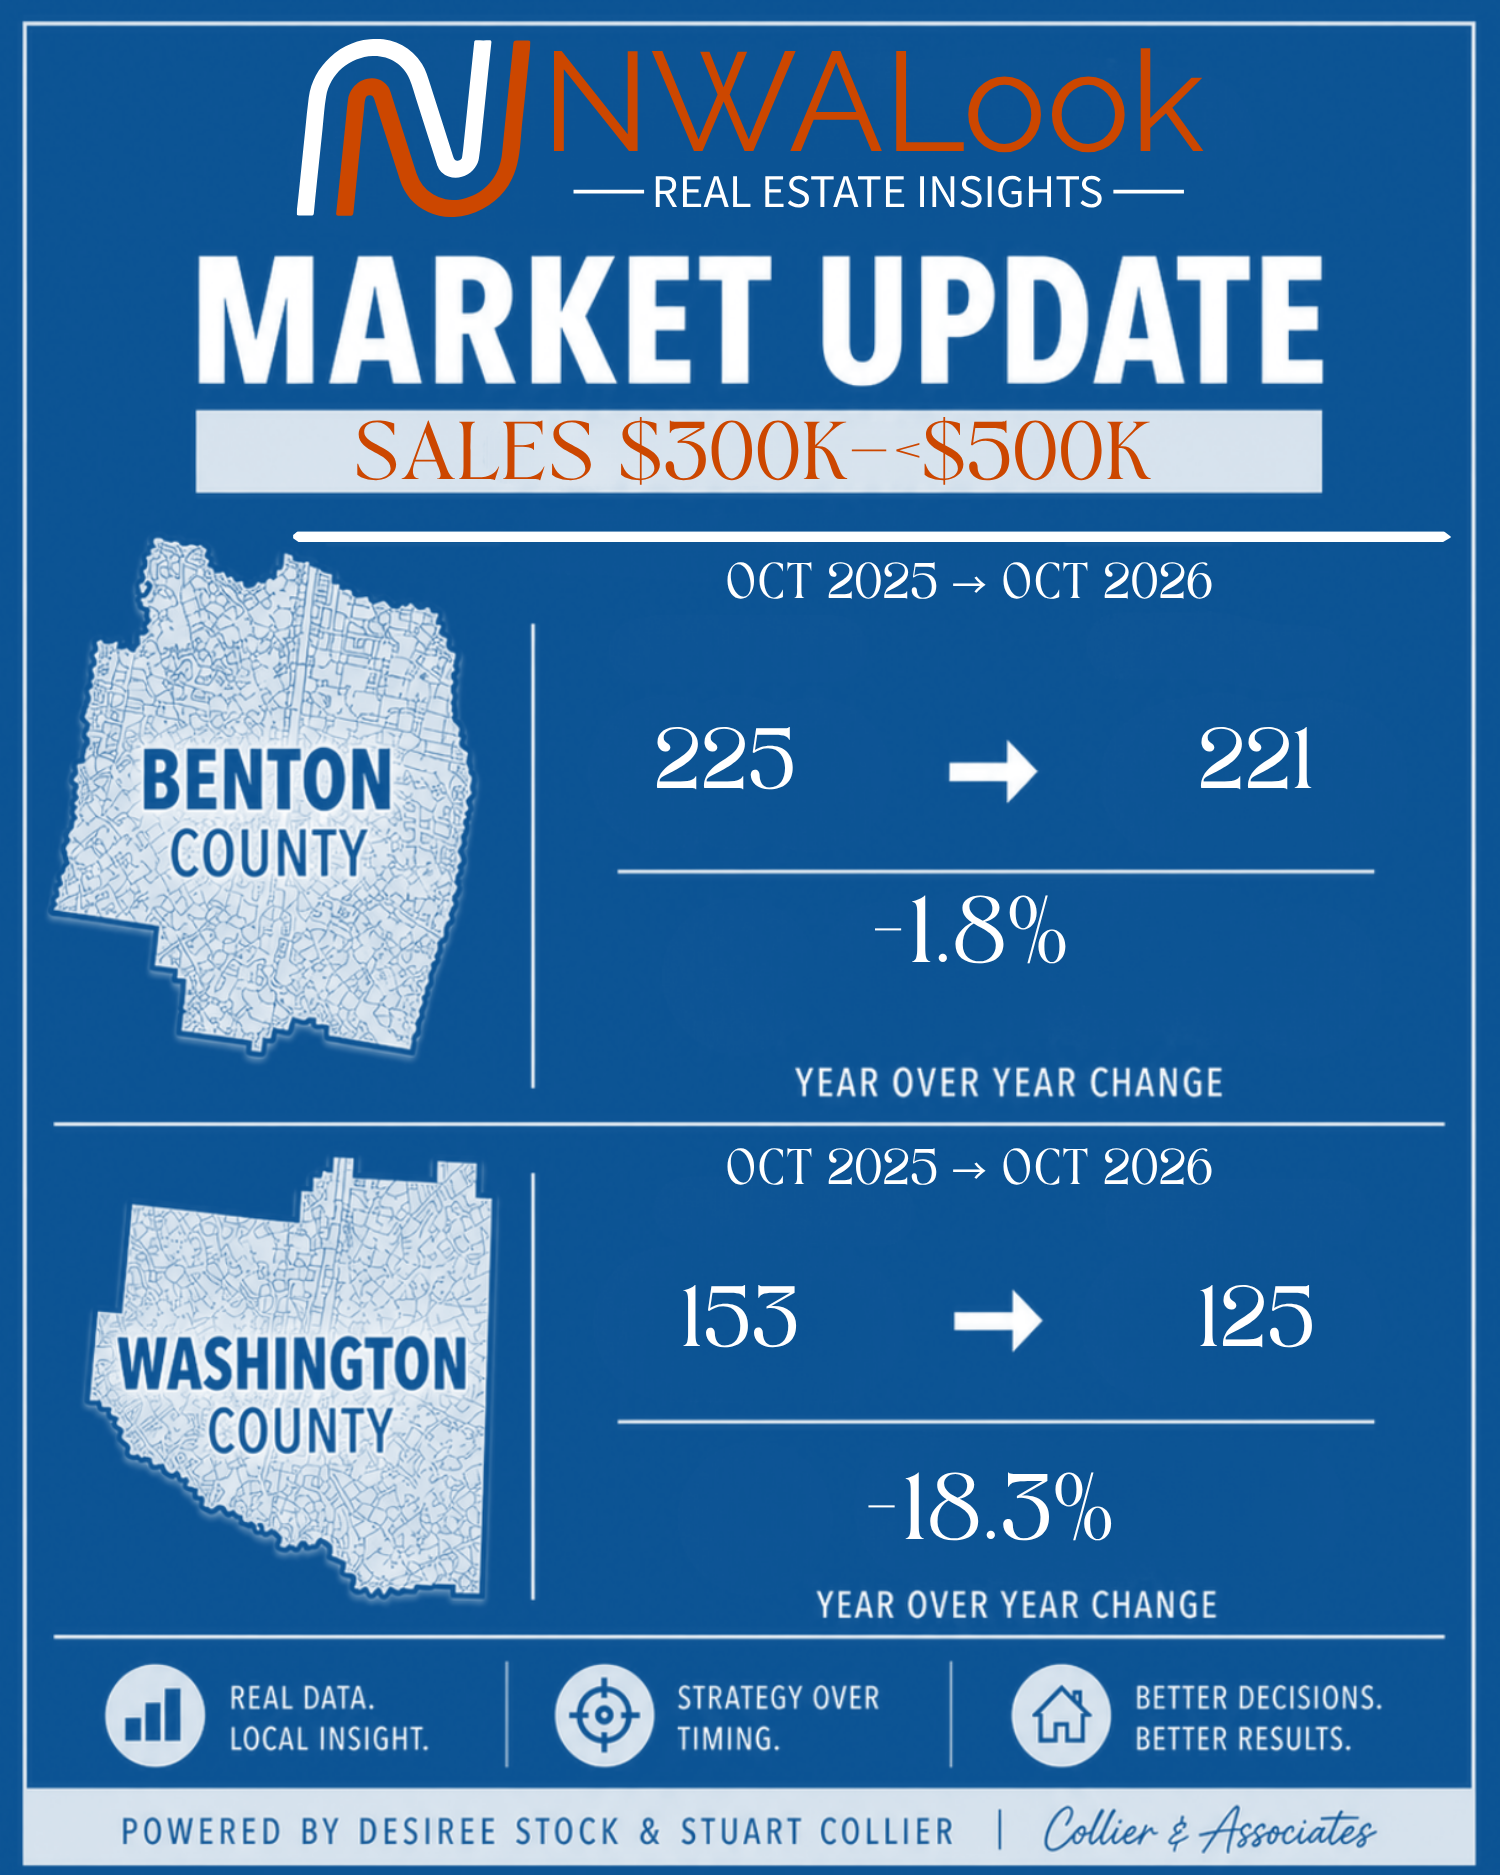
Benton County’s largest segment, $300,000 to under $500,000, recorded 221 sales, down from 225 in October 2025, a decline of just 1.8%. It represented 50.3% of the county’s closings, up from 40.6% a year earlier.
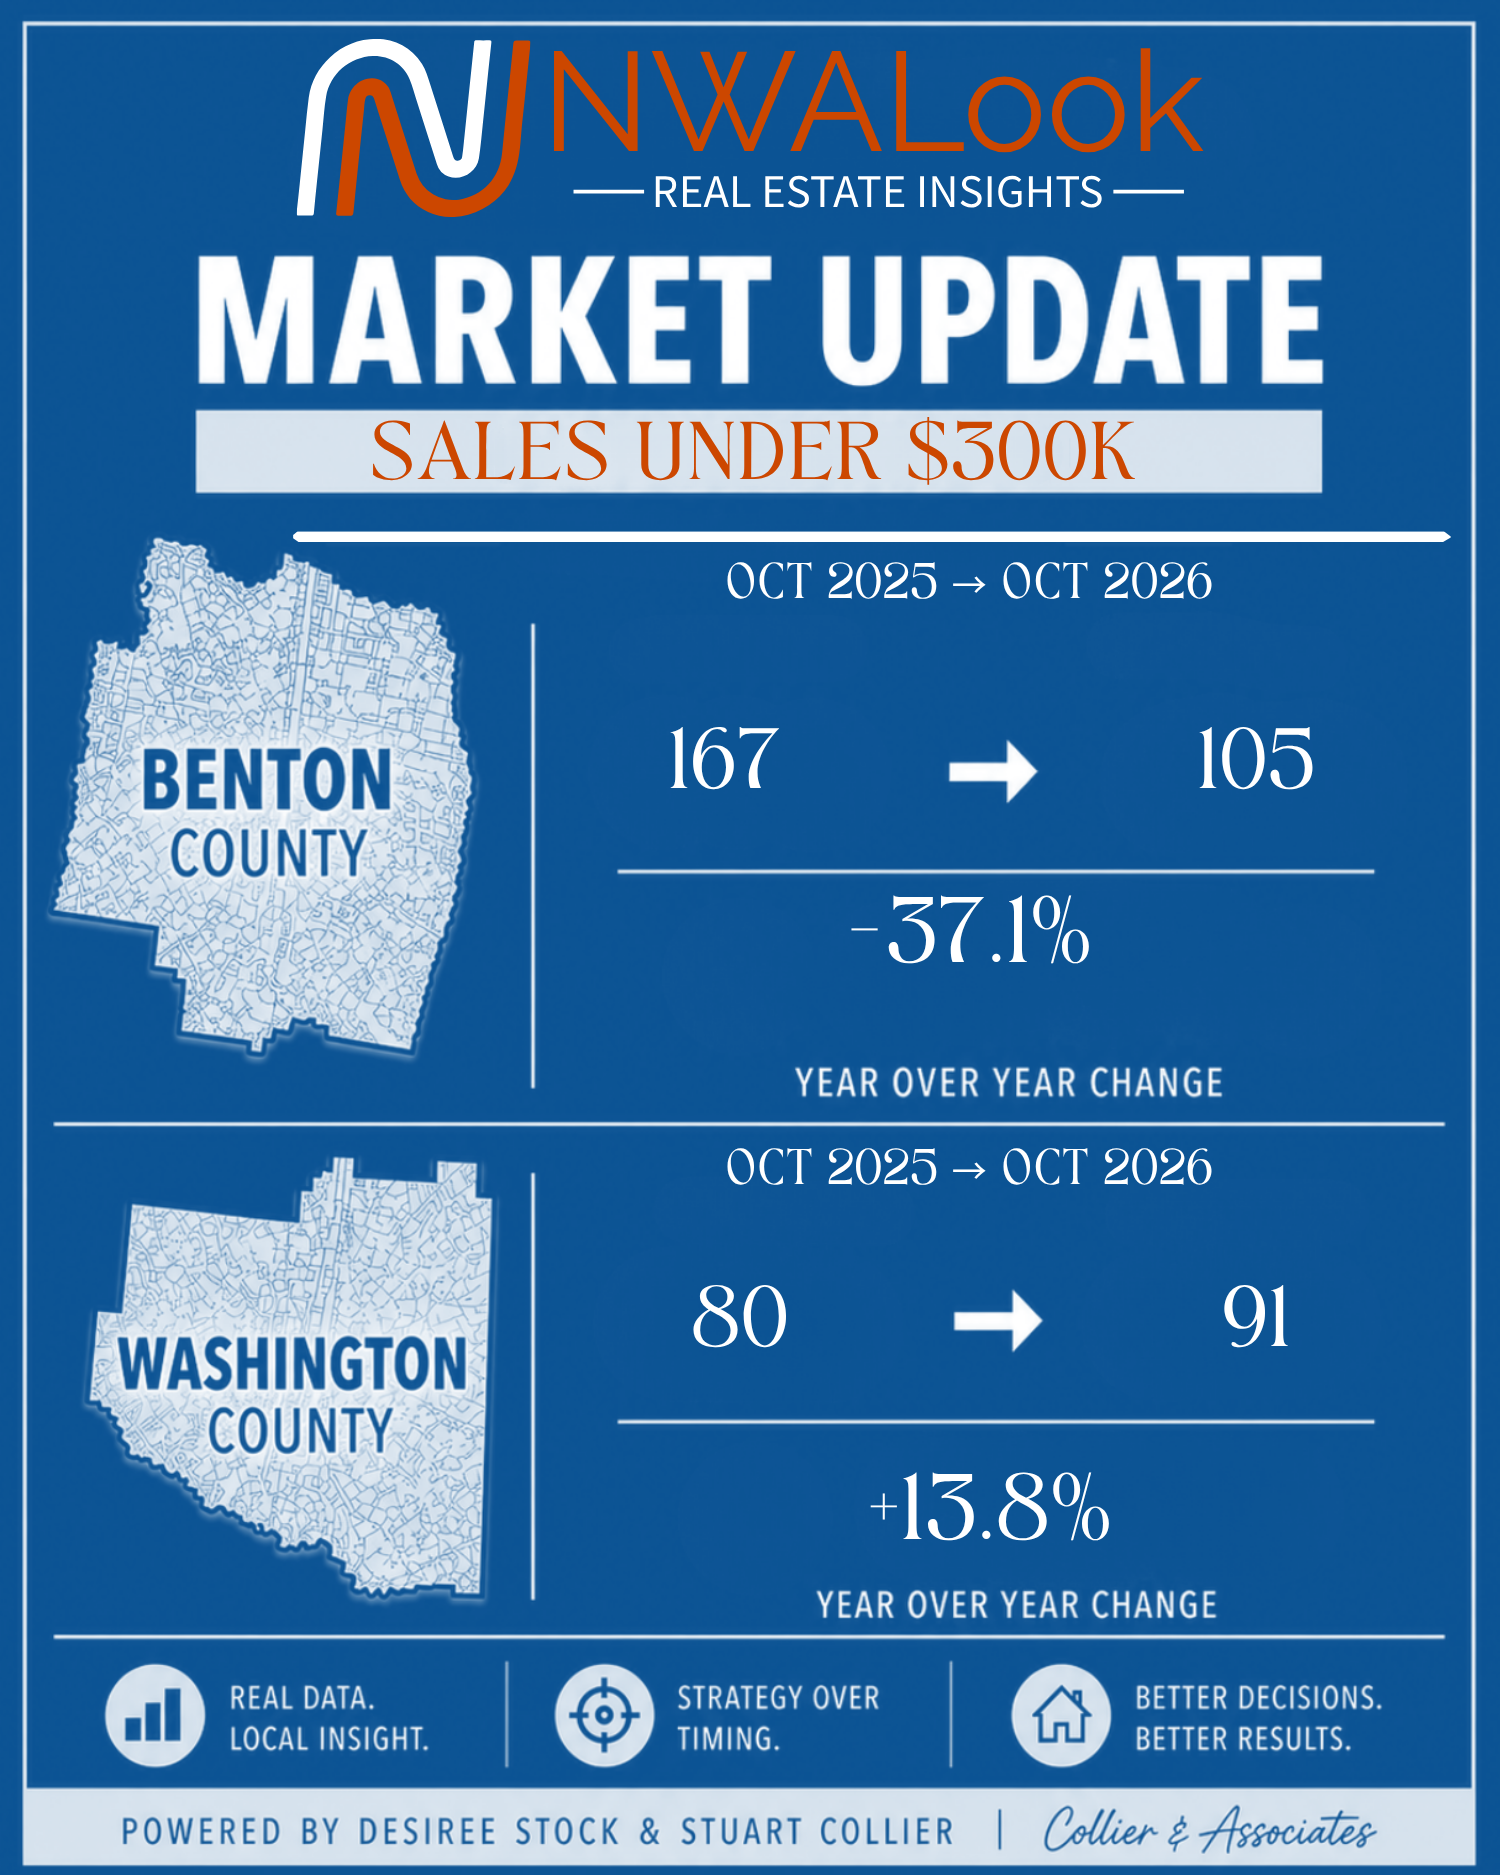
The largest decline was in sales below $300,000, where closings fell from 167 to 105, down 37.1%. Each bracket above $500,000 also recorded fewer sales. Benton County’s slowdown was therefore uneven across price ranges, with its busiest middle bracket holding up better than the others.
Washington County
Washington County recorded 91 sales below $300,000, up 13.8% from 80. That bracket grew from 25.6% to 32.2% of the county’s closings. Sales from $300,000 to under $500,000 declined 18.3%, from 153 to 125.
This larger share of lower-priced closings helps explain why the county median requires context. It is consistent with a shift in the mix of sales, though these grouped totals alone cannot isolate how much of the median-price change came from mix versus changes in comparable property values.
Luxury Sales: $1 Million and Above
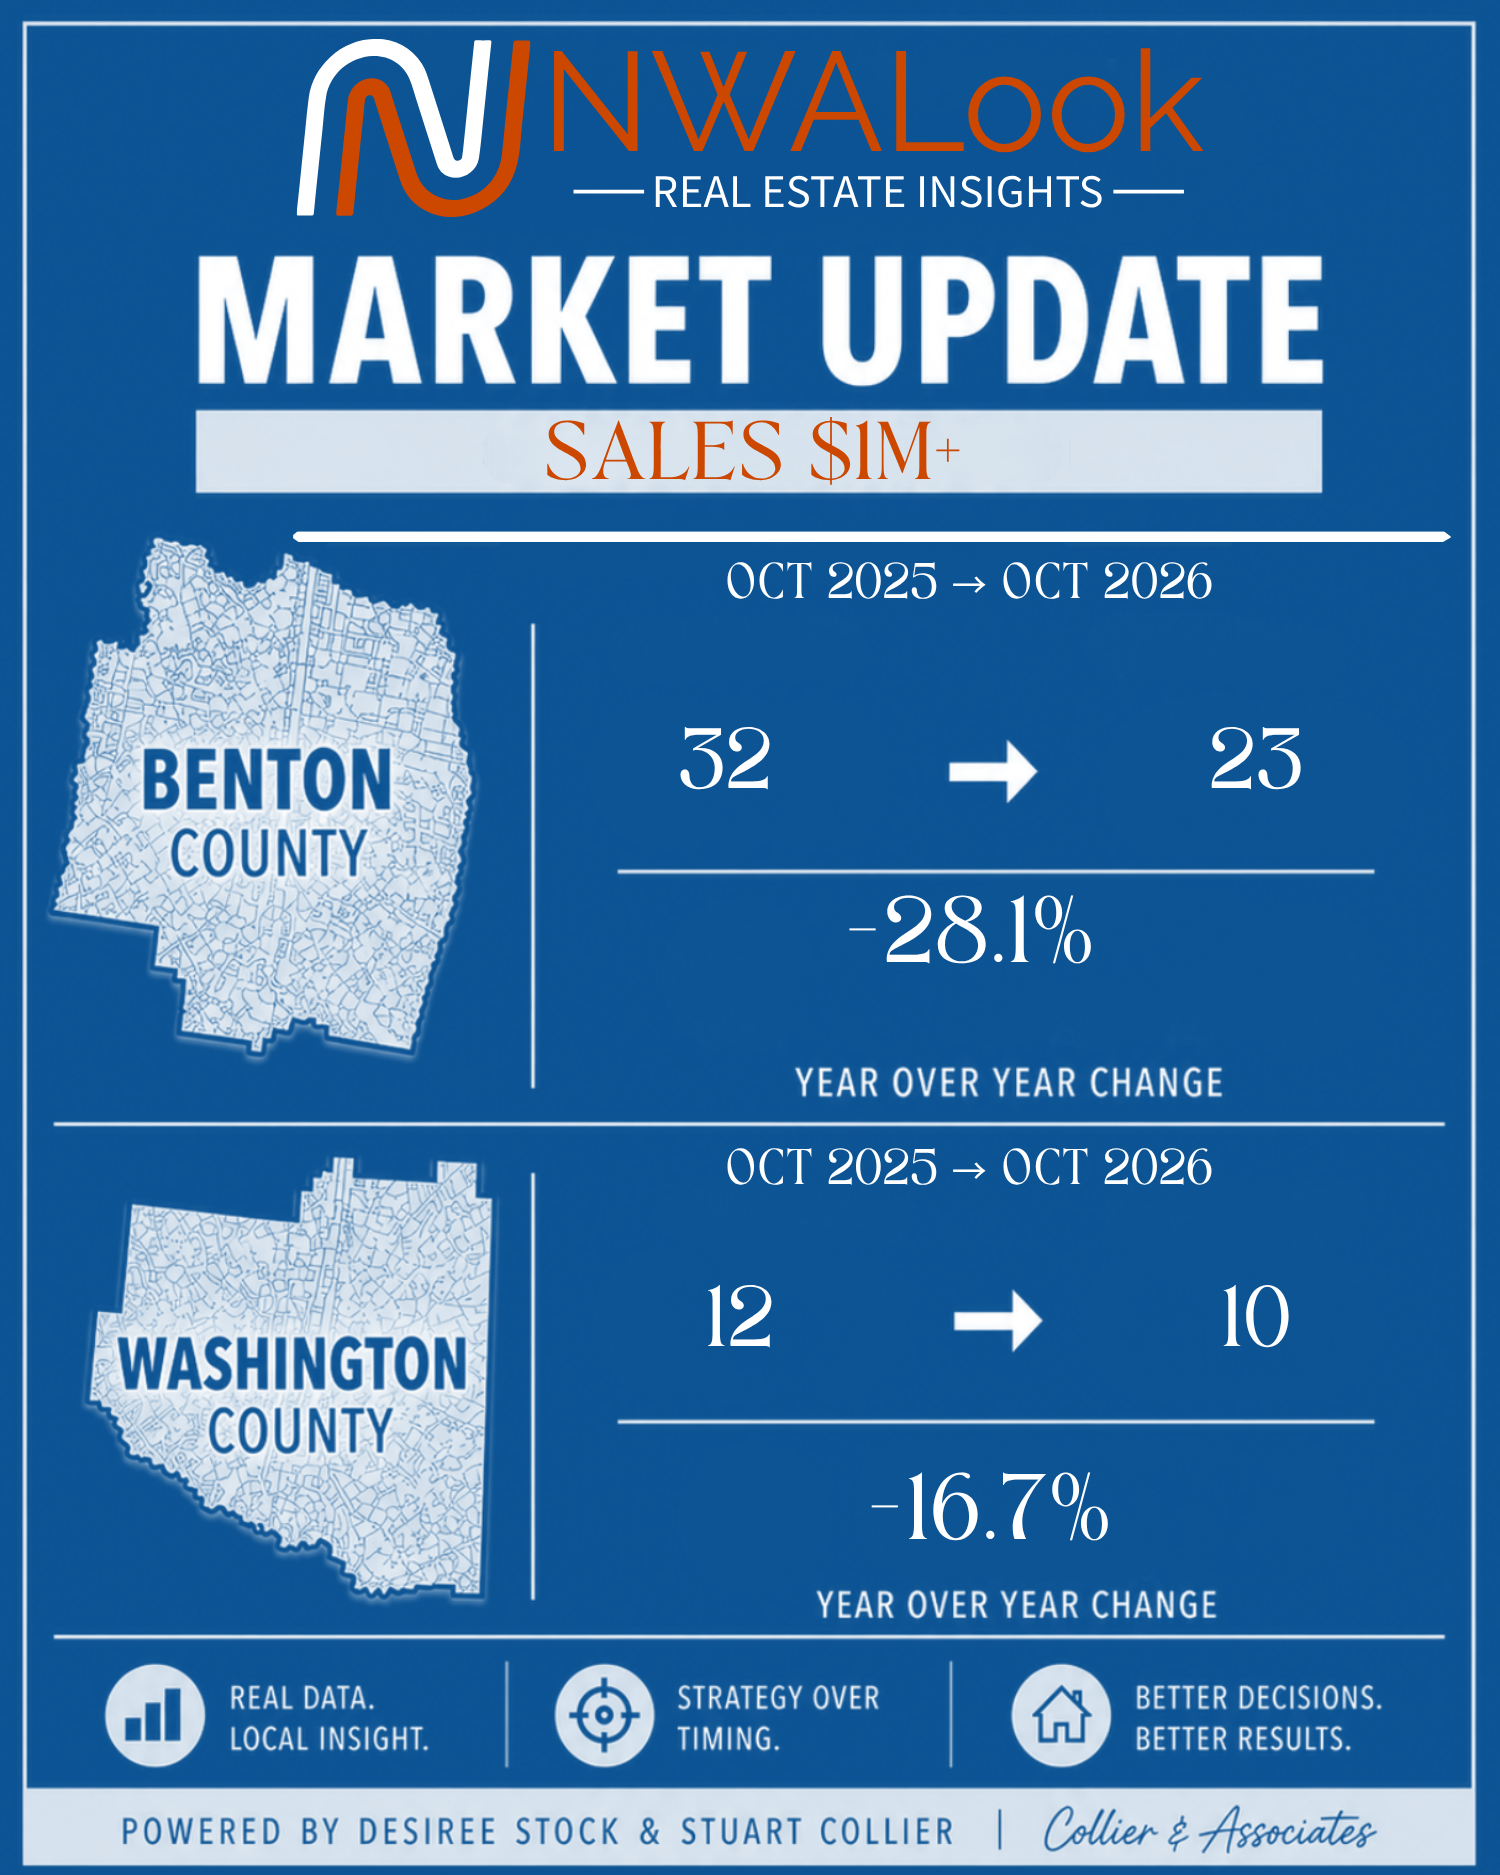
Benton County recorded 23 million-dollar sales, down 28.1% from 32 a year earlier. Their combined volume declined from $44,325,326 to $34,969,472. Washington County recorded 10, down from 12, or 16.7%, with volume moving from $16,715,500 to $13,434,777.
Together, the counties recorded 33 luxury closings, down 25.0% from 44. Luxury sales volume totaled $48,404,249, compared with $61,040,826, down 20.7%.
Sold Price per Square Foot Diverged by County
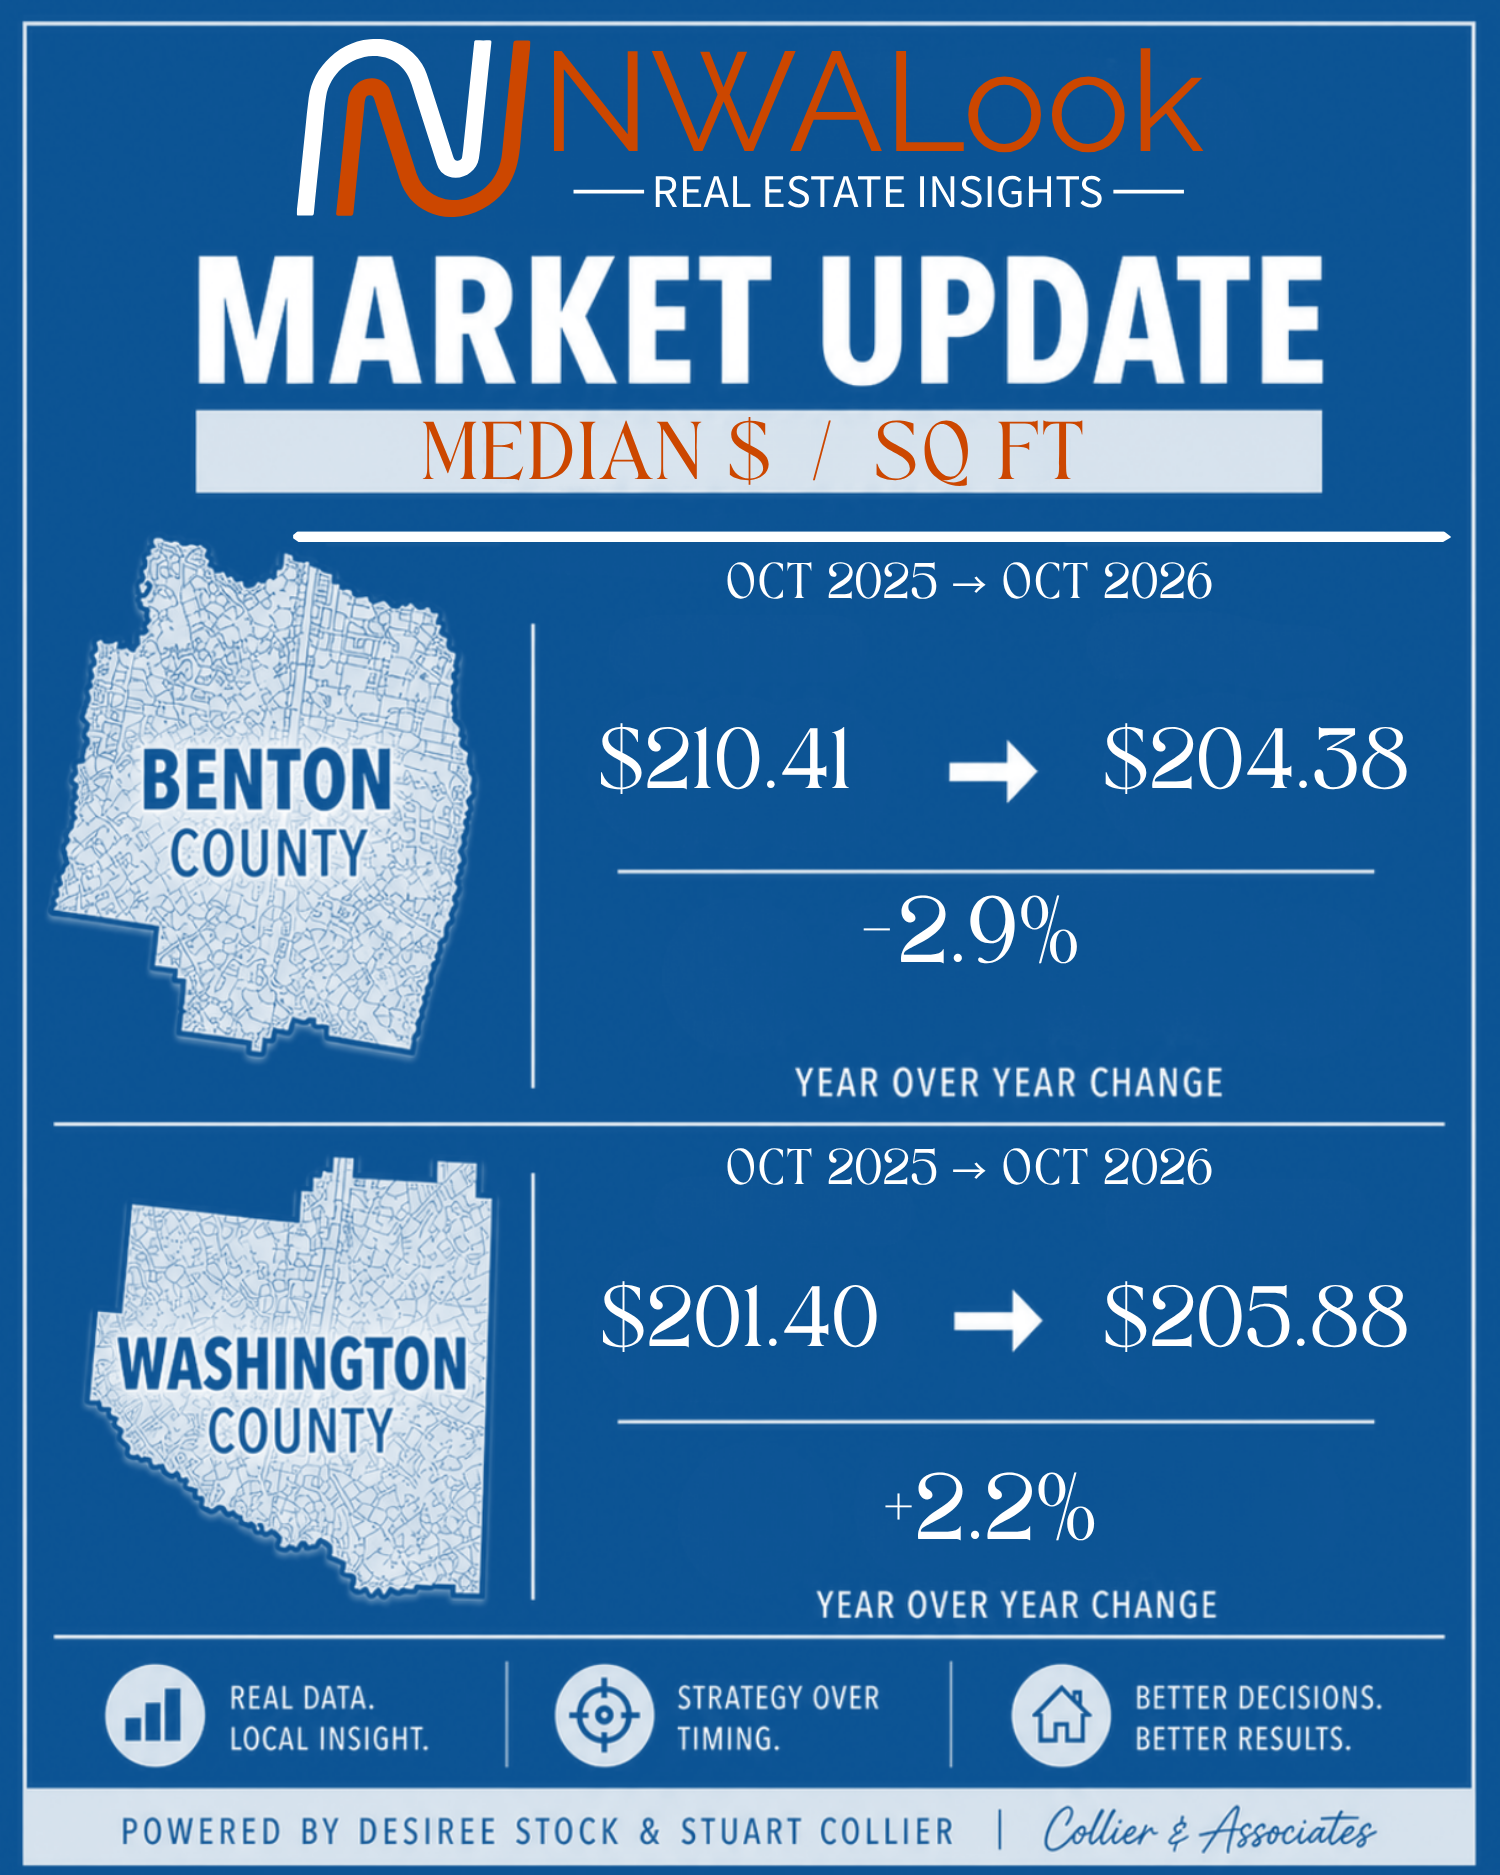
In Benton County, median sold price per square foot declined from $210.41 to $204.38, down 2.9%. Both the median total price and median price per square foot moved lower.
In Washington County, median sold price per square foot increased from $201.40 to $205.88, up 2.2%, despite the lower median sale price. Those measures can move in different directions when the size, location, and type of homes sold change.
Across both counties, median sold price per square foot declined from $207.57 to $205.33, down 1.1%. These figures use the median sold price per square foot for each transaction, not an active asking-price measure.
Original List Price to Close Price
Residential-only MLS measure · October 2025 vs. October 2026
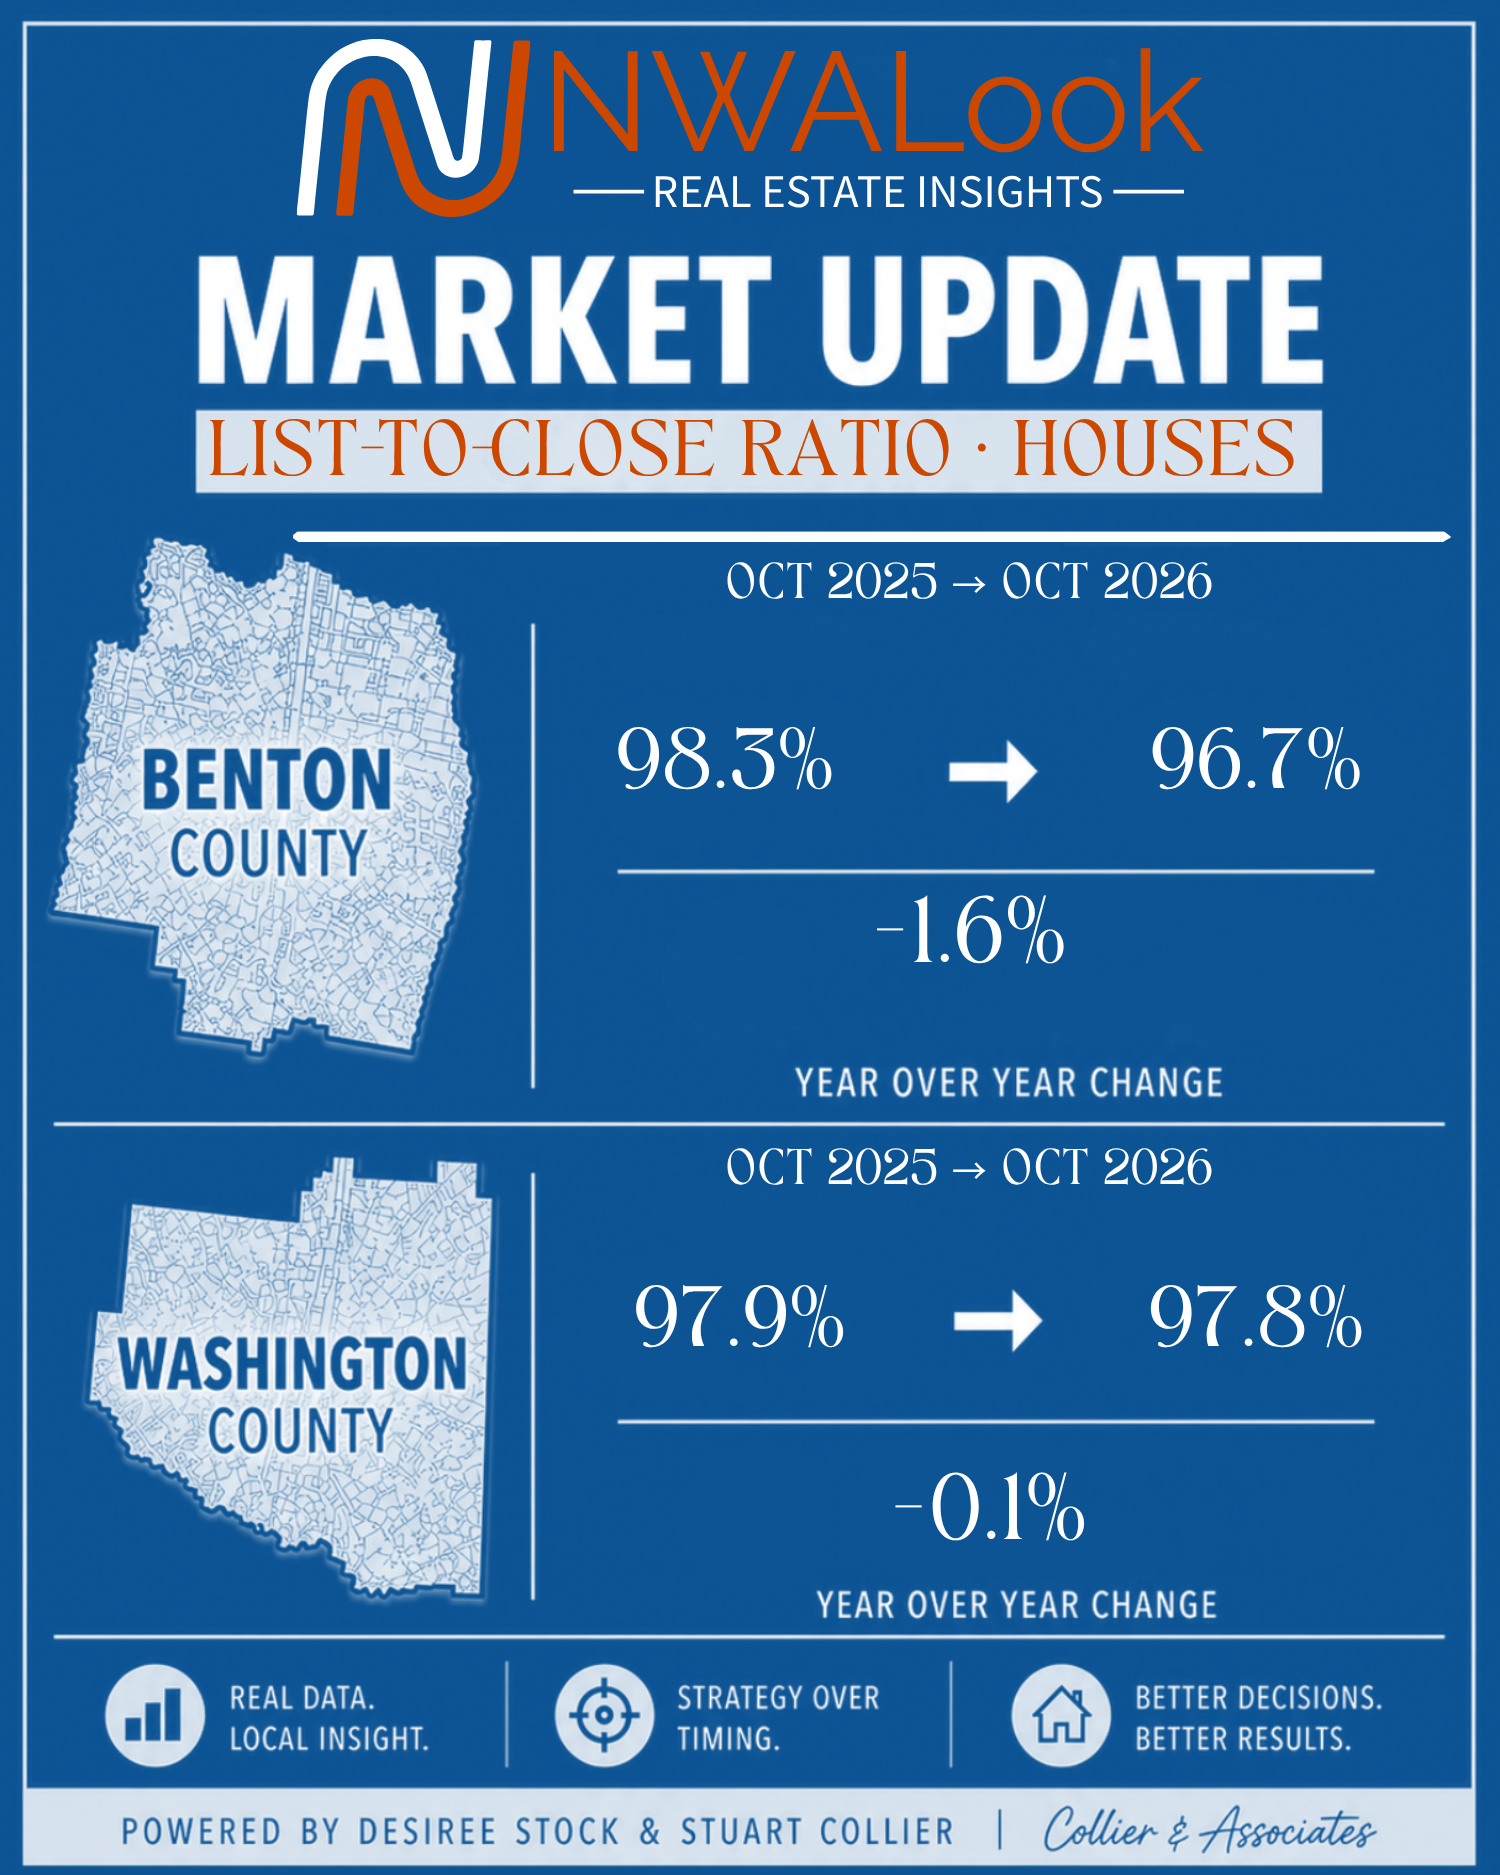
The supplied MLS close-price-to-original-price ratio declined from 98.3% to 96.7% in Benton County. In Washington County, it moved from 97.9% to 97.8%, a much smaller change.
For the residential-only transactions covered by this measure, Benton County’s result indicates closing prices moved farther below original asking prices than a year earlier. Washington County’s result was nearly unchanged. These reported ratios do not establish a discount every buyer can expect, and they do not measure the full effect of seller-paid closing costs or other concessions.
Closed Homes Took Longer to Sell, Especially in Benton County
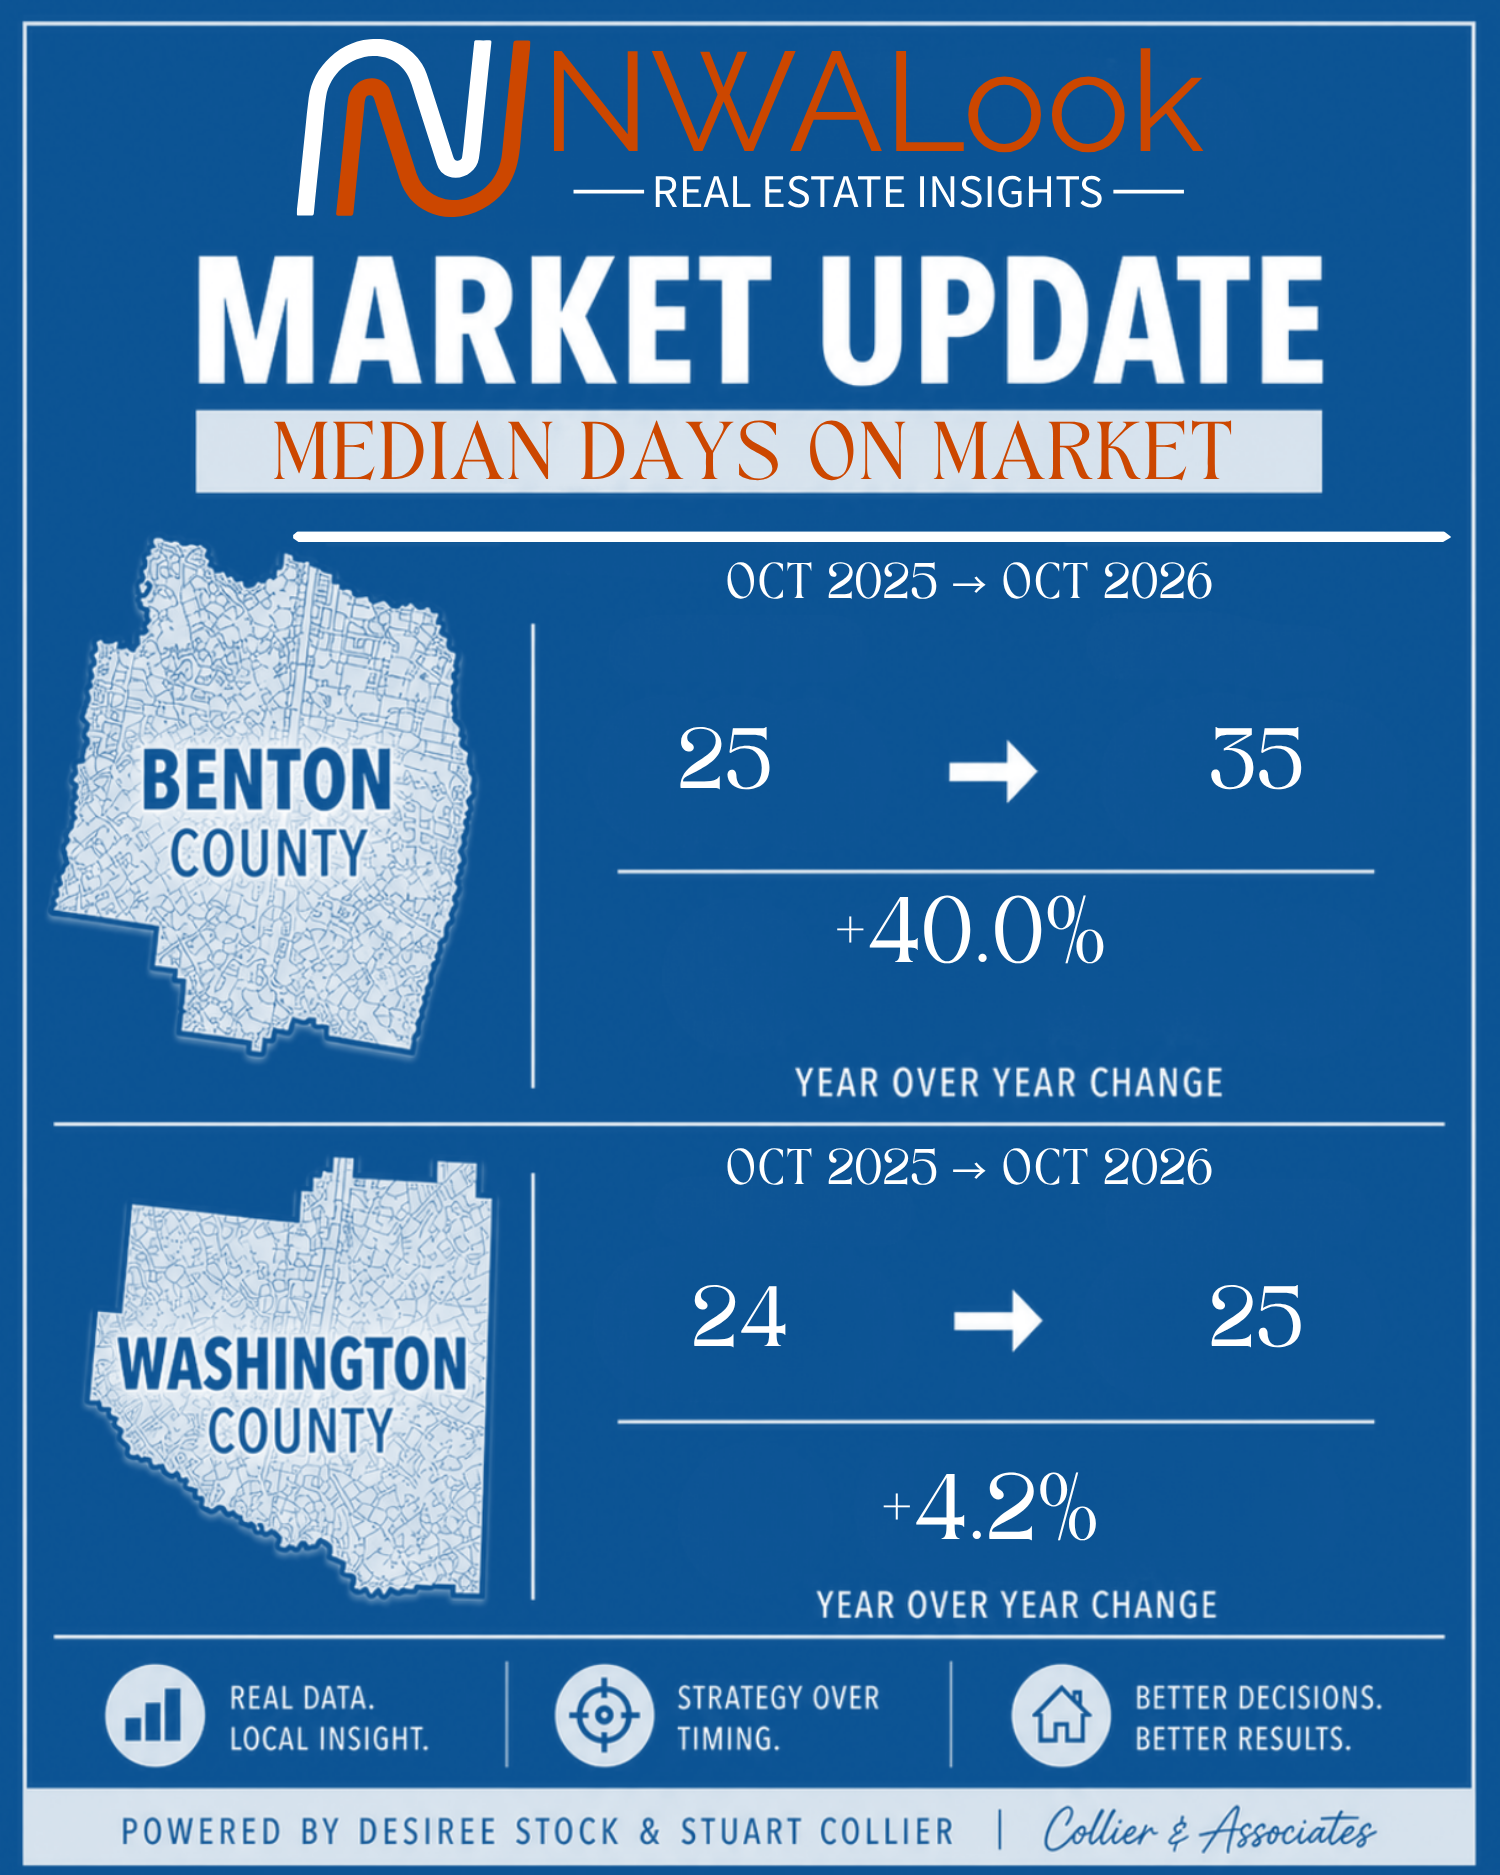
Benton County’s median days on market increased from 25 to 35, an additional 10 days, or 40.0%. Washington County’s median increased from 24 to 25 days, a 4.2% increase.
These are the marketing times for homes that closed during October. They do not measure how long every currently active home has been available or predict the time an individual listing will take to sell.
Sales Volume Fell More Than the Number of Closings
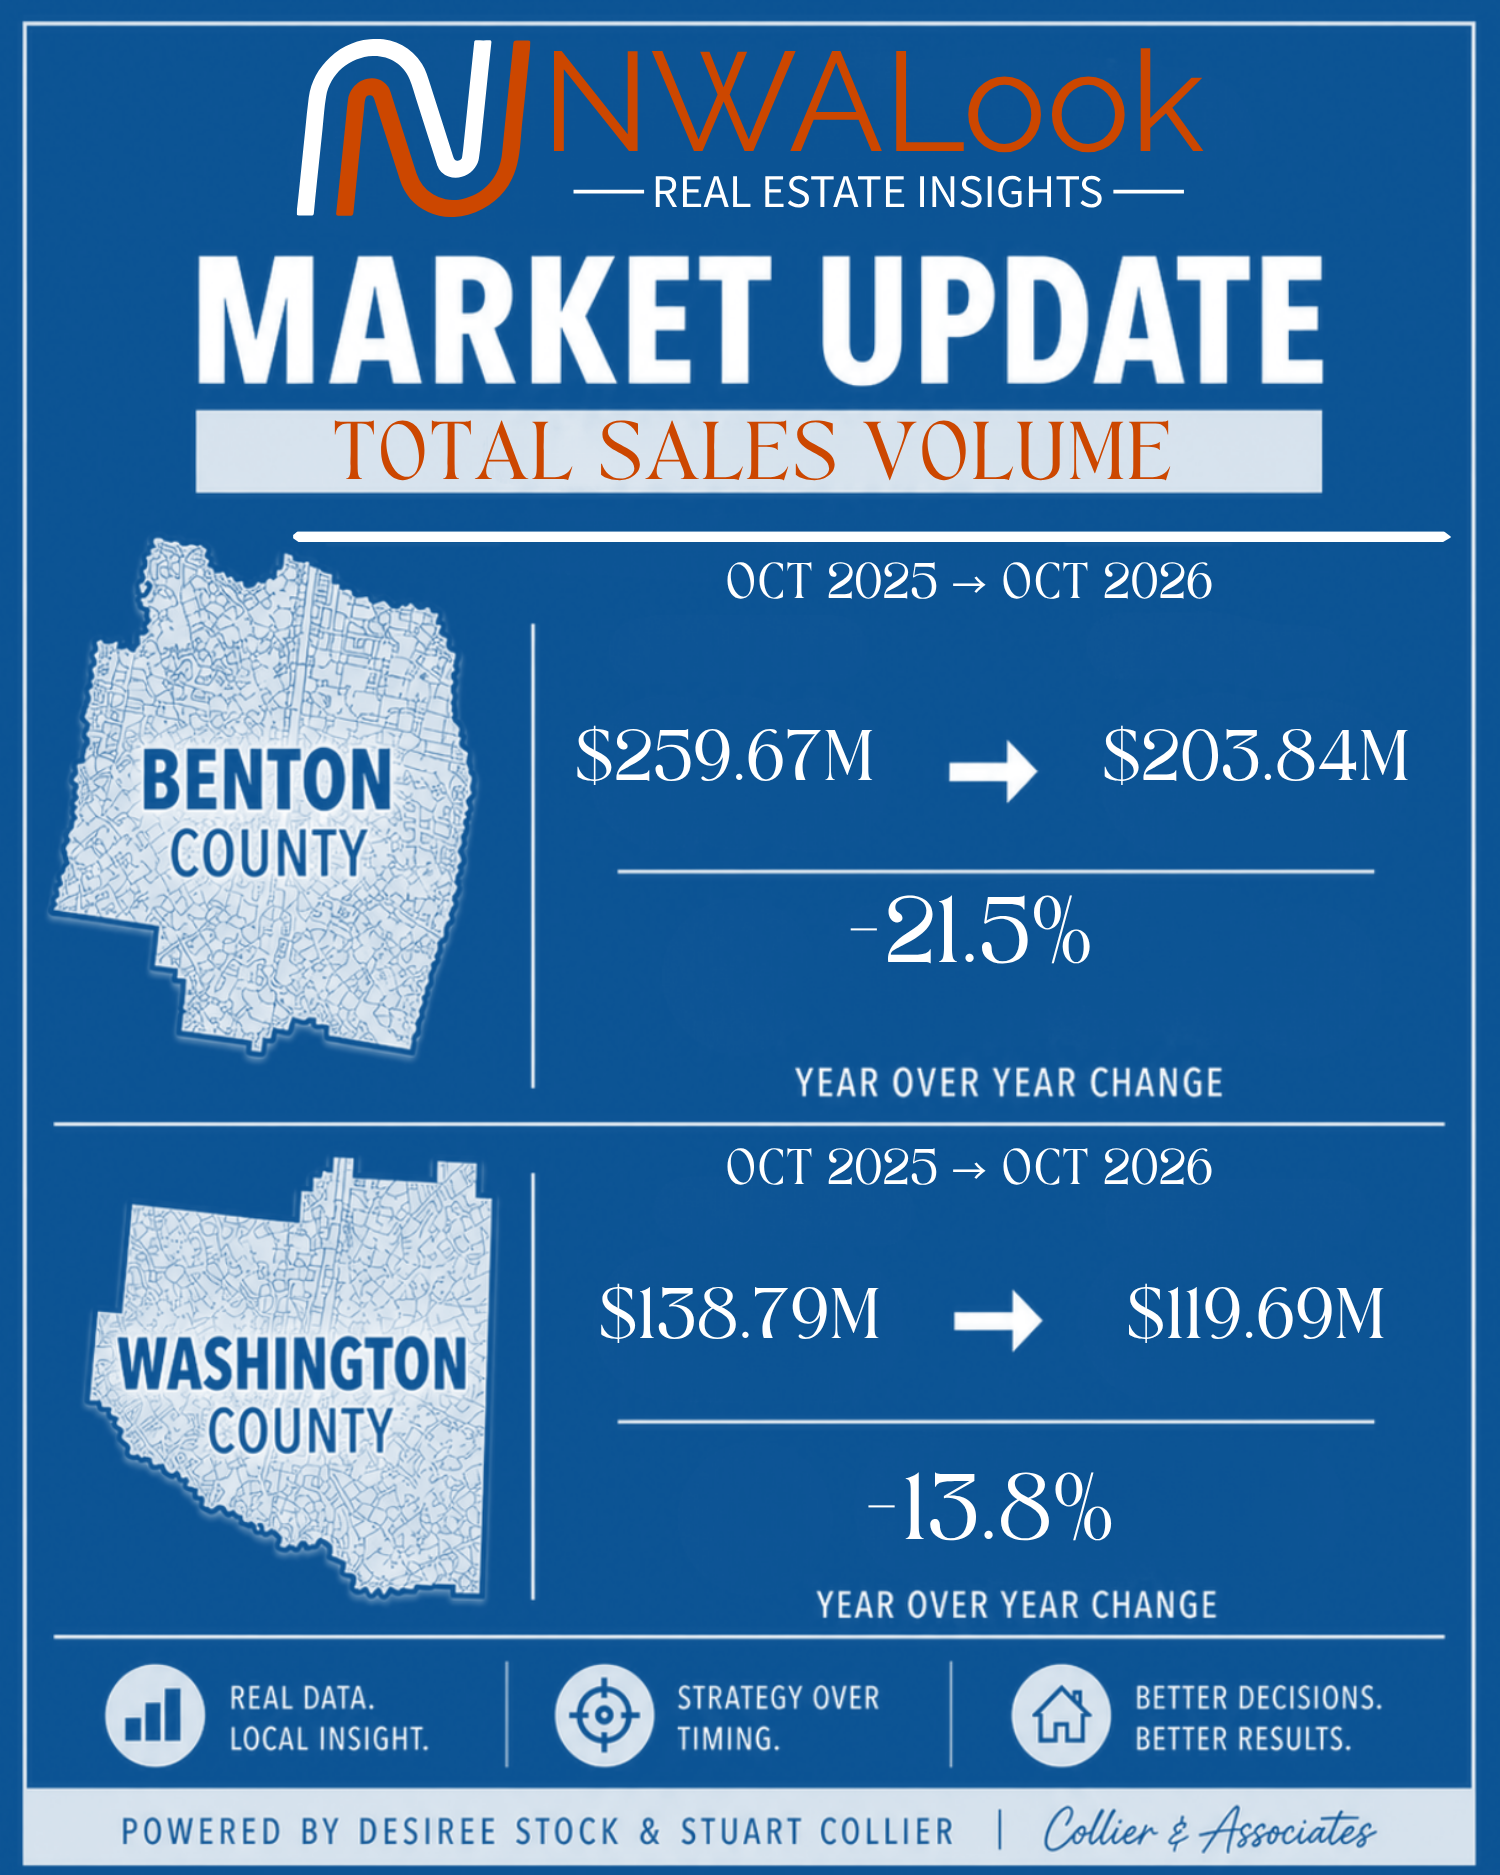
Benton County’s residential sales volume declined 21.5%, from $259,672,268 to $203,842,060. Washington County’s declined 13.8%, from $138,790,808 to $119,689,232.
Combined sales volume fell from $398,463,076 to $323,531,292, a decline of $74,931,784, or 18.8%. Fewer closings and a different mix of sale prices both contribute to the volume total.
New Listings and Pending Activity Both Declined
Benton County added 757 new listings, down from 923 a year earlier, or 18.0%. Its supplied pending cohort totaled 425 listings, down from 552, or 23.0%.
Washington County added 422 new listings, down 0.2% from 423. Its pending cohort totaled 258 listings, down from 331, a 22.1% decline.
Across both counties, new listings declined 12.4%, from 1,346 to 1,179. Pending activity declined 22.7%, from 883 to 683. The pending figures provide a separate view of contract activity; they should not be read as a guaranteed count of future closings.
Months of Inventory Increased in Both Counties
House-only MLS measure · October 2025 vs. October 2026
| County | October 2025 | October 2026 | Change |
|---|---|---|---|
| Benton County | 6 months | 8 months | +33.3% |
| Washington County | 5 months | 6 months | +20.0% |
Benton County’s reported months of inventory increased from 6 to 8, while Washington County’s increased from 5 to 6. This adds evidence of more supply relative to the sales pace in the house-only market, with the larger increase in Benton County.
Months of inventory reflects the relationship between available supply and the sales pace used by the MLS report. An increase does not, by itself, show that active listings grew; slower sales can also raise the measure.
Active House Listings Increased in Both Counties
| County · Houses only | October 2025 | October 2026 | Change |
|---|---|---|---|
| Benton County | 2,972 | 3,219 | +8.3% |
| Washington County | 1,454 | 1,642 | +12.9% |
Benton County’s reported active house listings increased by 247, from 2,972 to 3,219. Washington County’s increased by 188, from 1,454 to 1,642. Combined, the reported count increased from 4,426 to 4,861, up 9.8%.
What October Means for Buyers and Sellers
October’s clearest signal is a slower transaction pace. Both counties had fewer closings and fewer listings in their pending cohorts than a year earlier. That context helps set expectations, but it does not create the same negotiating conditions at every price point.
For Benton County sellers, the longer median marketing time and the larger decline in closings support a careful review of recent comparable sales, competing listings, and price positioning. The relative steadiness of the $300,000–$499,999 bracket shows why a countywide headline needs a closer look.
For Washington County buyers and sellers, the increase in sub-$300,000 closings and the rise in median sold price per square foot highlight how much the mix matters. A lower county median alone doesn't determine a specific property's value.
Want to understand what these numbers mean for your home or next purchase? If you are not already represented, I can help you compare local sales, competition, and purchase terms.
Desiree Stock
Executive Broker | Collier & Associates
(479) 409-4241
HomesNWA.com | NWALook.com

Featured Listing of the Week
🏡 6 Linfield Lane, Bella Vista, AR 72715
Nearly $30,000 Price Reduction + Buyer Incentives
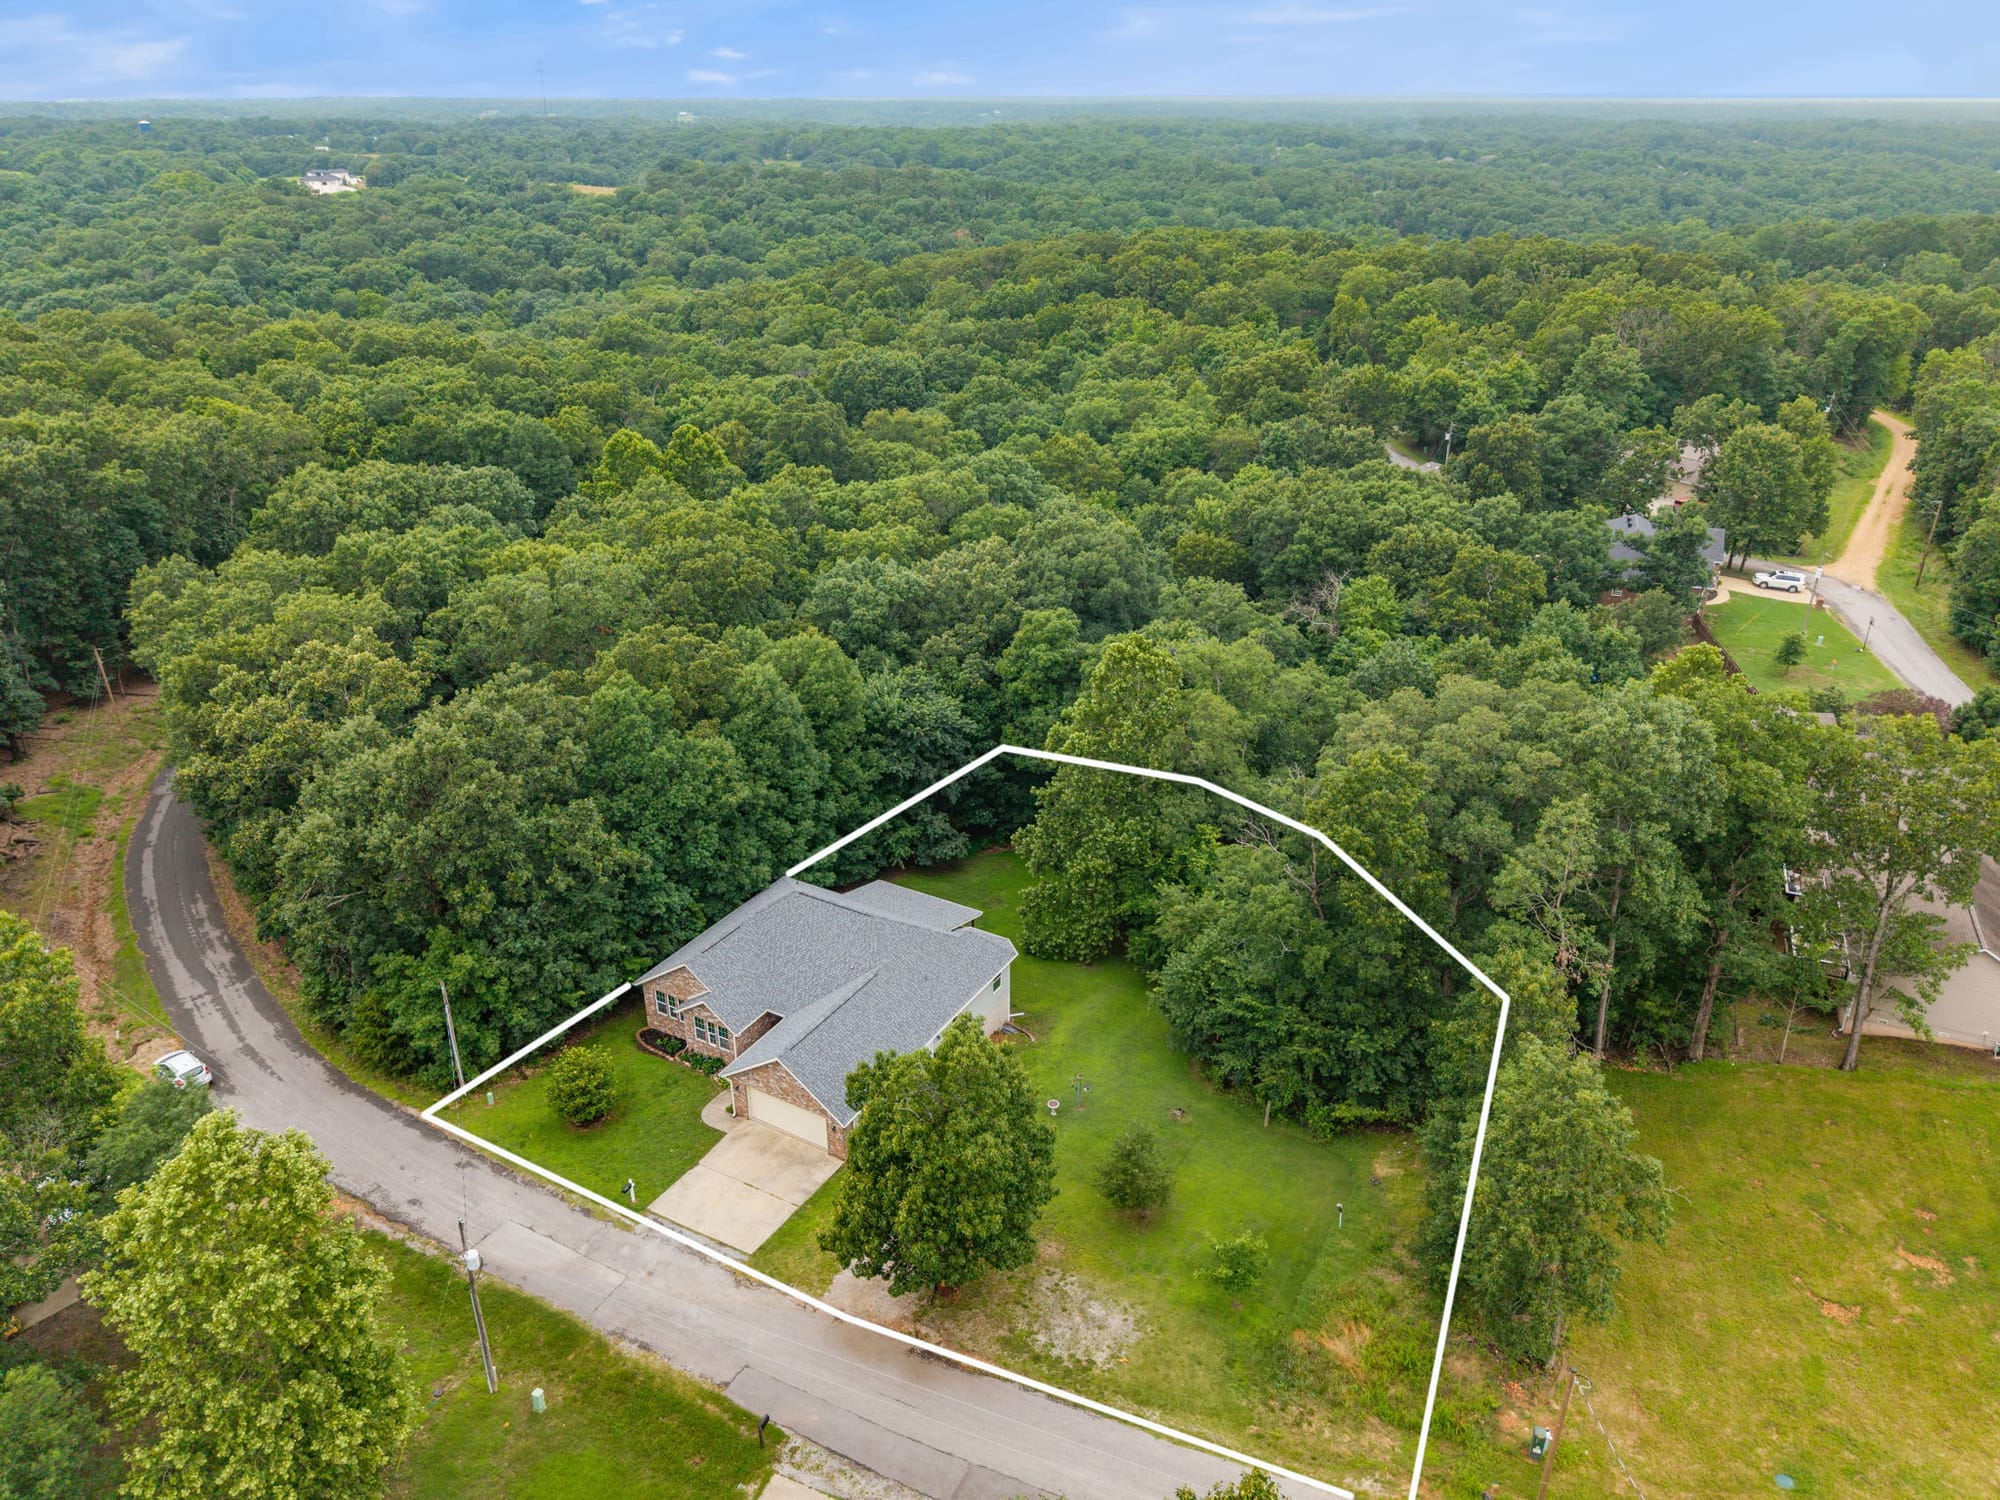
💰 $535,000 🛏 4 Bedrooms 🛁 3 Full / 1 Half Bathrooms 📐 3,048 Sq Ft 🌳 0.52 Acres 🏗 Built in 2007
Now offered at $535,000, reduced from $564,900—a $29,900 price reduction. The seller is offering up to $15,000 toward a rate buydown, and the preferred lender is offering up to $5,000 in lender credits toward eligible buyer closing costs and/or lender fees. These incentives offer qualified buyers an opportunity to reduce financing costs alongside the lower asking price; terms and conditions may vary.
Located in Bella Vista’s Chatburn subdivision within the Bentonville School District, this home offers flexible living space on a wooded-feeling half-acre setting near trails. The open main level features LVP flooring, an electric fireplace, and a renovated kitchen with white Shaker cabinetry, granite countertops, a subway-tile backsplash, stainless steel appliances, and abundant storage.
The primary suite includes a renovated bath with dual vanities, granite countertops, a walk-in tiled shower, and multiple closets. Two additional bedrooms, a full bath, and a half bath are also on the main level. Downstairs, the finished walkout basement adds a large second living area, dry bar, bedroom, full bath, and office space for guests, multigenerational living, or working from home.
A covered deck overlooks the surrounding trees and wildlife, while the patio provides additional outdoor living space. An attached two-car garage and access to Bella Vista’s trails and community amenities complete the offering.
🤝 Listed by: Desiree Stock, Executive Broker
📞 (479) 409-4241
🏢 Collier & Associates
📞 Office: (479) 274-0662
MLS #: 1352987
Incentives are subject to loan program guidelines, credit approval, and borrower qualification. Buyers are not required to use a specific lender; another lender may be asked to match the offer, but matching is not guaranteed. Listing information and incentives are subject to change without notice. Confirm details with the listing agent and lender.
Most Expensive Sales of the Week
October 25–31, 2026 · Residential closed sales
Benton County
🏡 2602 E Battlefield Boulevard, Bentonville, AR 72712
💰 Sales Price: $1,100,000
📅 Sold Date: 10/30/2026
MLS #: 1334343
🤝 Represented by:
Seller’s Agent: Kimberly Wilichowski | 1 Percent Lists Arkansas Real Estate
📞 Direct: (479) 531-6154 | Office: (479) 445-9389
Buyer’s Agent: Lauren Boozman Northey | Portfolio Sotheby’s International Realty
📞 Direct: (479) 899-8204 | Office: (479) 273-6697
Washington County
🏡 4546 Caddo Lane, Fayetteville, AR 72704
💰 Sales Price: $1,187,500
📅 Sold Date: 10/28/2026
MLS #: 1360398
🤝 Represented by:
Seller’s Agent: Michael Sims | Bassett Mix And Associates, Inc
📞 Direct: (479) 427-0209 | Office: (479) 521-5600
Co-listing Agent: Kasey Harvey Tanner | Bassett Mix And Associates, Inc
📞 Direct: (512) 212-6055 | Office: (479) 521-5600
Buyer’s Agent: Erica Baker | Collier & Associates
📞 Direct: (479) 200-9400 | Office: (479) 274-0662
NWA Real Estate Market Update
October 25–31, 2025 vs. October 25–31, 2026 · Benton and Washington counties combined
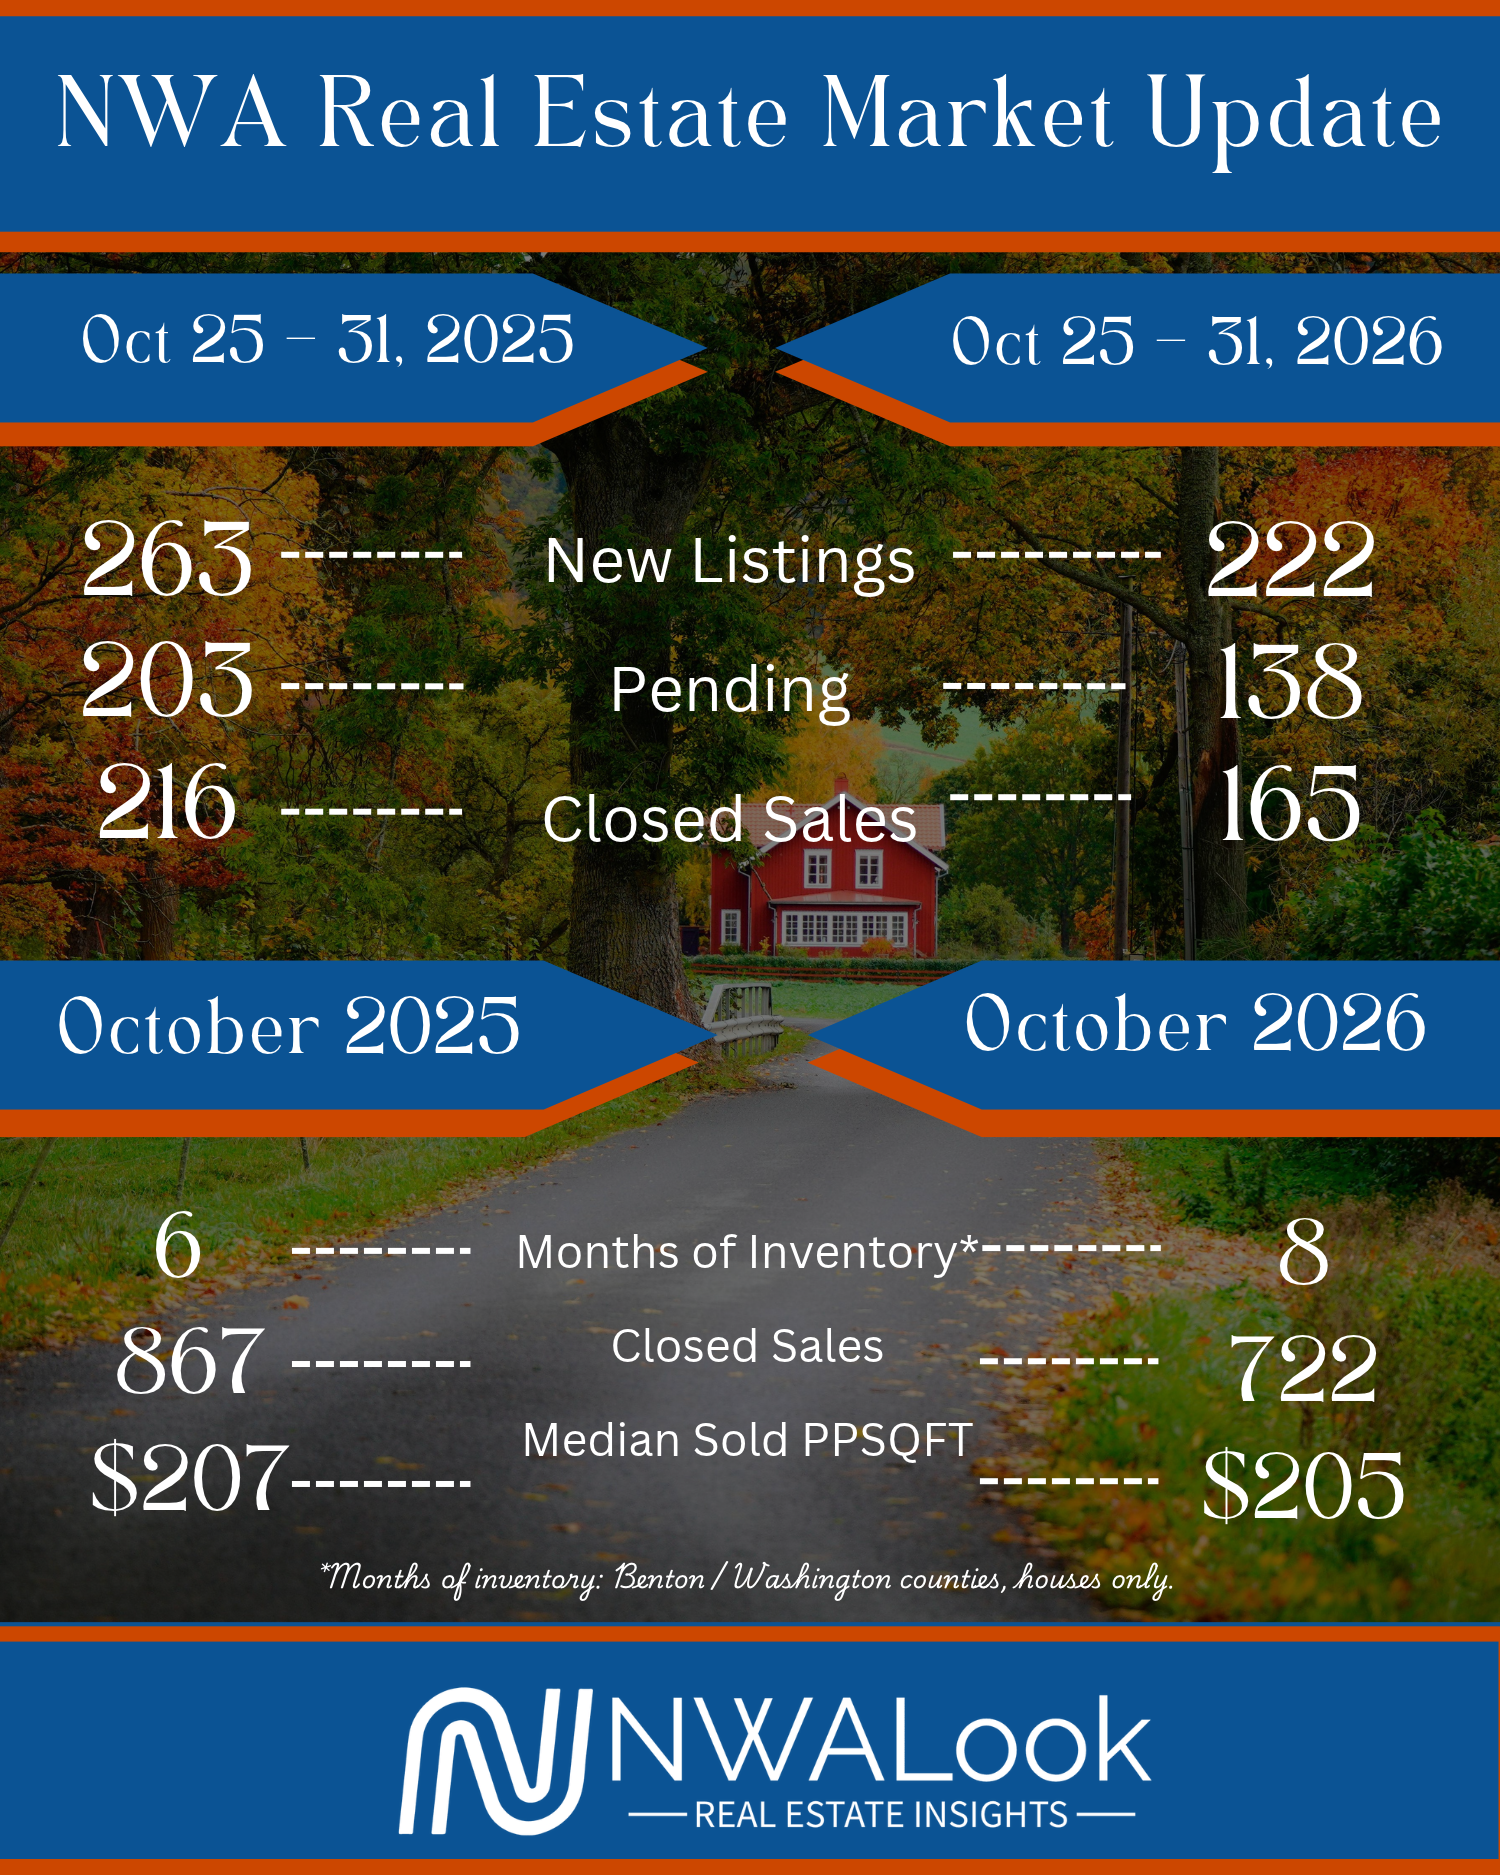
Compared with the same dates in 2025, new listings declined 15.6%, pending activity declined 32.0%, and closed sales declined 23.6%.
Northwest Arkansas Weekly Rundown
October 25–31, 2026 · All residential closed sales
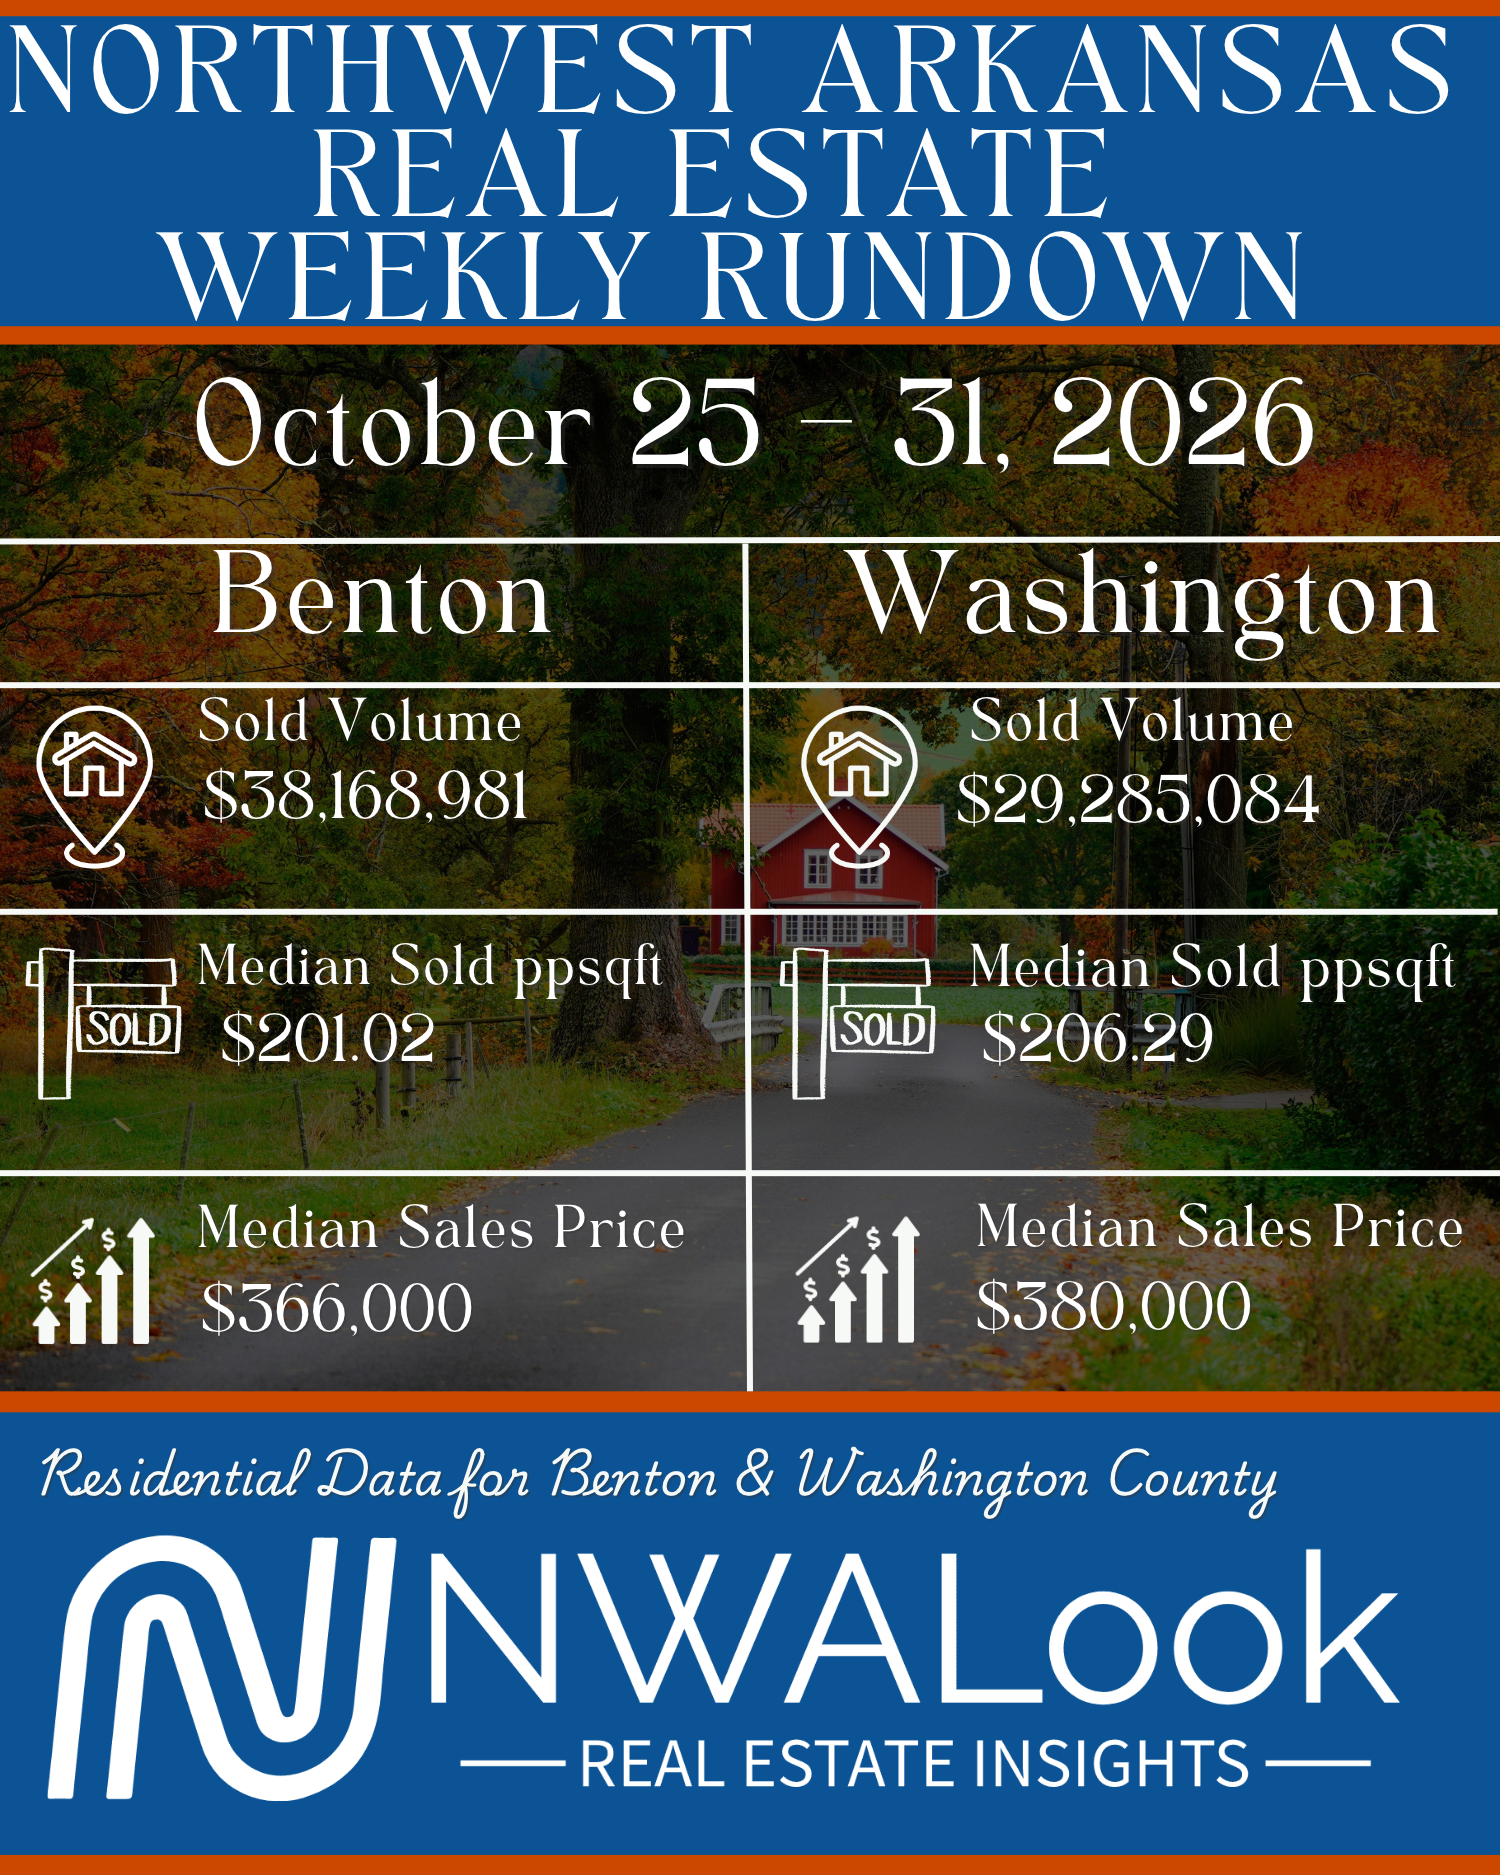
Benton County recorded 94 closed sales, and Washington County recorded 71.
Mortgage Market Update
Leadership Tip of the Week: Define What "Done" Looks Like
A task can sound clear until two people describe what it means to finish.
“Get the report ready” might mean one person pulls the numbers and another delivers a checked, formatted document. Both can work hard and still end up with different results.
Before work begins, agree on the outcome: Who will use it? What needs to be included? When is it needed? What does a finished version look like?
For a client presentation, that might mean verified numbers, sources included, and a final copy ready to send by Thursday morning. A clear finish line helps someone plan the work and know when it is complete.
Leave room for questions and judgment along the way. The goal is shared understanding of the result.
Leadership Tip: Choose one assignment this week and describe what “done” means in a single sentence. Ask the person doing the work to explain the outcome back in their own words.
— Desiree
NWA Planning Meetings by City
Development decisions start long before the construction equipment arrives. Follow the planning conversations happening in your community.
View NWALook's planning meeting guide. Confirm current meeting dates, agendas, and locations with the city before attending.
Support Local. Reach Local.
Have a business, service, or event you'd like Northwest Arkansas readers to know about? For NWALook advertising opportunities, email Crew@NWALook.com.
Stay Connected With NWALook
Know someone who would find this week's article useful? Forward this edition and invite them to subscribe at NWALook.com.
Follow NWALook on Instagram and Facebook.
Desiree Stock, Executive Broker & Stuart Collier, Principal Broker at Collier & Associates, co-founded NWALook to help buyers, sellers, investors, and the community understand Northwest Arkansas real estate.

Source: MLS residential exports for Benton and Washington counties, received November 2, 2026. Closed-sale cohorts use Sold Date October 1–31, 2025 or 2026. New-listing cohorts use Listing Contract Date in the corresponding October; pending cohorts are counted as supplied because the export does not include a pending-date field. Counts are unique MLS numbers within each cohort; all rows are retained regardless of current status. Medians are calculated from individual records; sales volume sums reported sold prices. Sold PPSF uses sold price divided by heated square footage; all closed records have positive heated area. Price bands use reported sale price. October 2025 has 867 closings, and October 2026 has 722. Changes use unrounded calculations and are displayed to one decimal. The separately supplied MLS active-listing, months-of-inventory, and close-price-to-original-price-ratio reports cover Residential, Sub Type = House, October 2025 and October 2026. Their reported values are used directly rather than calculated from the broader CSV cohorts. Figures reflect the supplied exports and may change as MLS records are corrected.
This newsletter provides general information and does not replace property-specific real estate, lending, legal, or investment advice. Verify property details and financing terms with the appropriate professionals. This newsletter is not intended to solicit or interfere with clients represented by another real estate professional. Equal Housing Opportunity.


